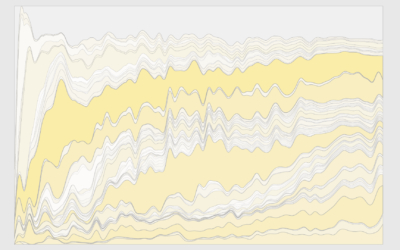
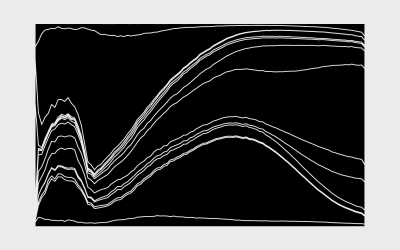
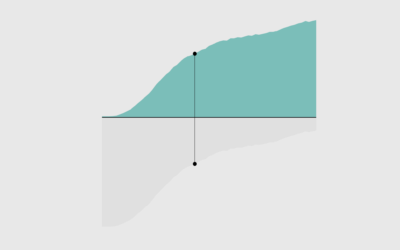
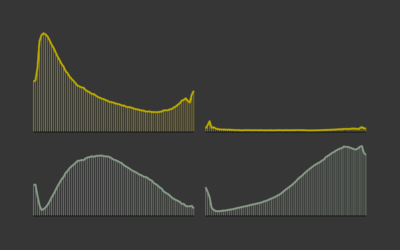
The space between the data and the baseline is filled with a color or a pattern, usually emphasizing counts or percentages for a single variable.
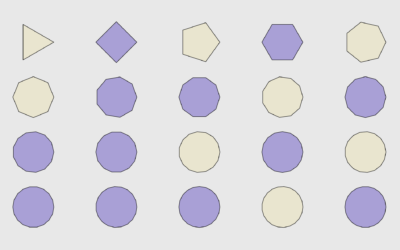
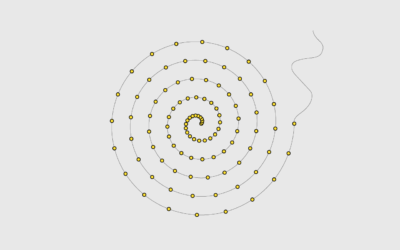
R provides functions for basic shapes, but you can also draw your own for maximum fun.
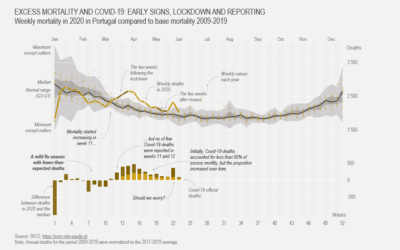
The discussions this week felt familiar. Probably because we've seen this many times, since the beginning of charts themselves.
You could use a package, but then you couldn't customize every single element, and where's the fun in that?
Show current evolution against expected historical variability and add one or more series that could account for the difference.
There are many ways to show parts of a whole. Here are quick one-liners for the more common ones.
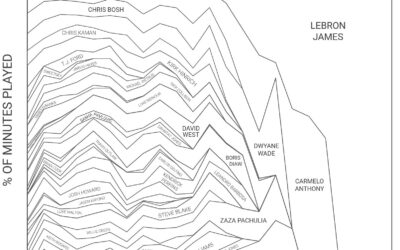
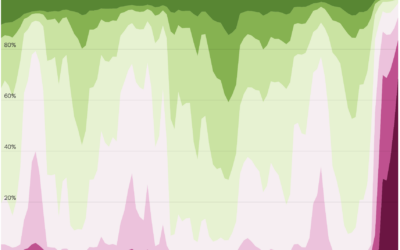
Stacked area charts let you see categorical data over time. Interaction allows you to focus on specific categories without losing sight of the big picture.
Fun stacked area chart by Todd Whitehead for Sportradar, showing the share of…
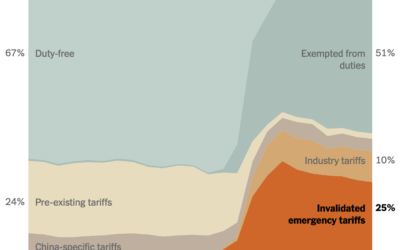
The U.S. Supreme Court ruled the administration’s “emergency” tariffs to be illegal. This…
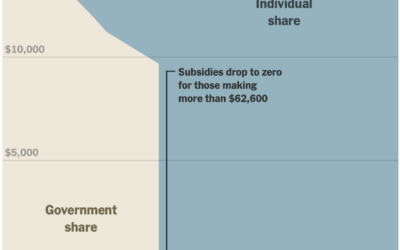
In January, the scale for U.S. healthcare subsidies changed, which reintroduced a cliff.…
Given the season, I wondered about the time we spend with others and who we spend our limited hours with.
The Trans News Initiative is a collaborative effort to track news coverage of…
At the beginning of this year, most people probably had little awareness or…
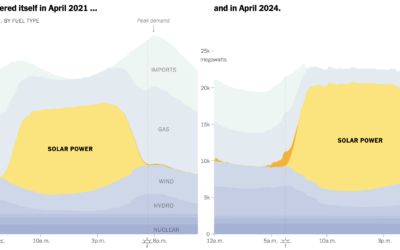
When there is an excess of solar energy during the day, it can…
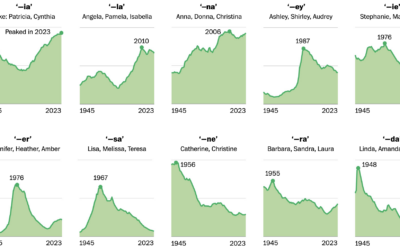
Because everyone who is 30 years and older loves getting asked when they're going to settle down and get married.
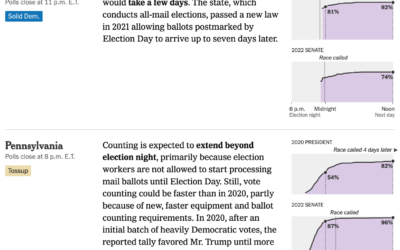
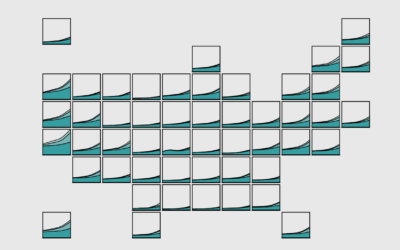
Some states count quickly, whereas others can take days. For NYT, Alicia Parlapiano…
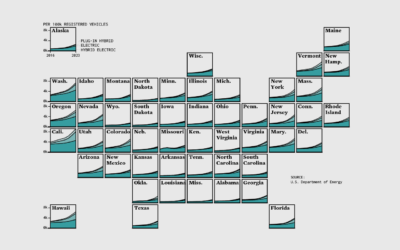
About 4% of registered light-duty vehicles in the United States are either electric,…
Breaking it down to the small steps and choices with data, code, and editing that lead to a finished chart.
One-third of households are rented and the other two-thirds are owned or in the process. However, the difference between renting and owning changes with age.
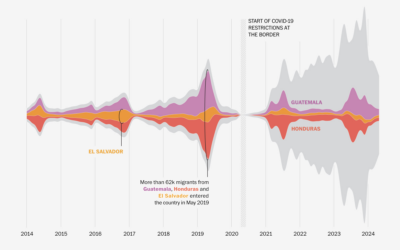
A lot of immigration talk in the U.S. focuses on Mexico, but immigrants…
For WP’s Department of Data, Daniel Wolfe analyzed baby name data with Laura…
To capture solar energy for use in the evening, batteries have grown in…
For The Upshot, Emily Badger and Francesca Paris compare the rates of existing…