Christopher Wolfram explains his “unnecessarily detailed analysis” of the spelling game from the New York Times:
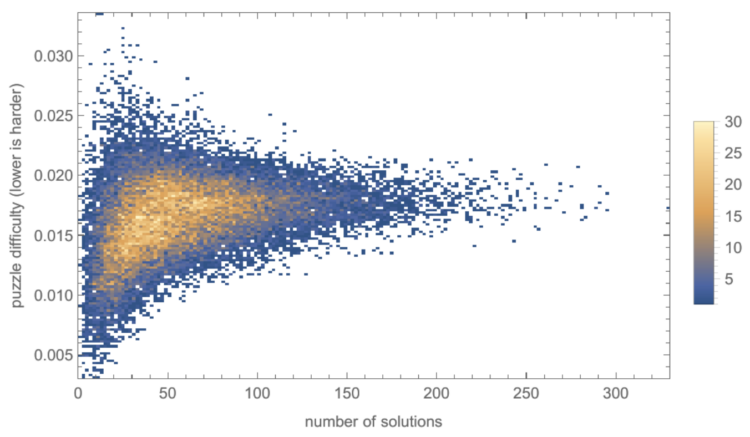
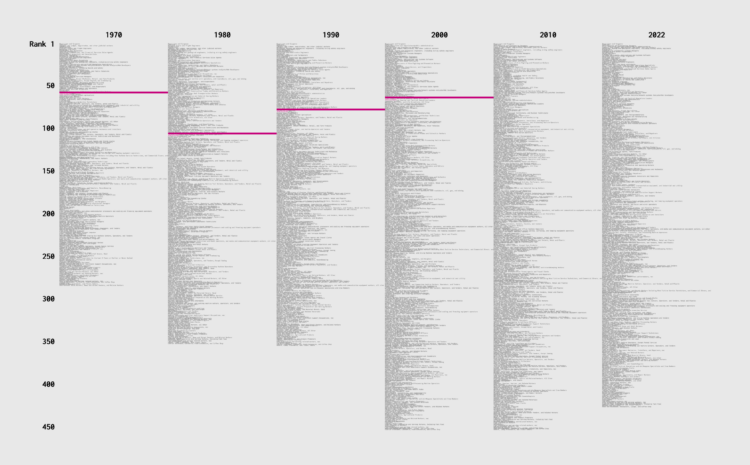
By this analysis, I argue that puzzle difficulty should be judged by the difficulty of the hardest word which the player must guess in order to reach Genius. The score required to reach Genius equals 70% of the total number of points available, so we can calculate puzzle difficulty by the 30% quantile of the difficulties of solution words weighted by their scores. (It’s the 30% quantile instead of the 70% quantile because lower word difficulty corresponds to harder words.) This measure has the advantage that it is a bit like taking the “average” of the solution word difficulties, but it also takes into account the score threshold for Genius. Let’s call this measure the puzzle difficulty.
 Visualize This: The FlowingData Guide to Design, Visualization, and Statistics (2nd Edition)


