This week, we focus on when there is a sudden change or flip in the data that you want to highlight.
highlight
-
Members Only
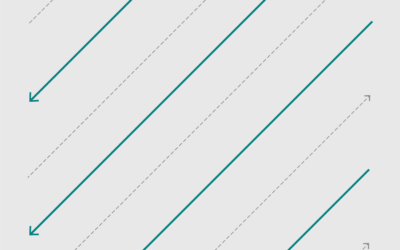
Showing when the data flips
-
Members Only

Remake the chart, from reference to interesting bits
Today, we rework a chart to focus on the useful bits.
-
Members Only

Breaking Out of Chart Software Defaults
Defaults are good for quick and disposable charts. However, when the audience extends beyond yourself, it’s time to customize around purpose.
-
Members Only
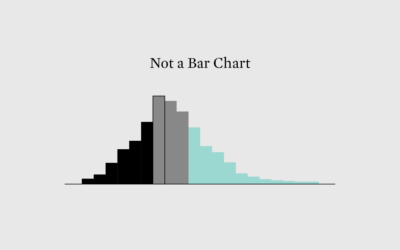
Histograms for Regular People
People need a sense of how distributions work before they can make sense of a histogram. Here’s how I (try to) make these misunderstood charts easier to read.
-
Members Only
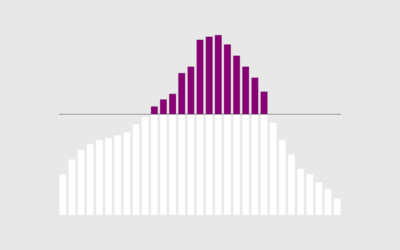
Focus Change
A few lines and a color fill can change how others see a dataset.
Recently for Members
Second Edition
 Visualize This: The FlowingData Guide to Design, Visualization, and Statistics (2nd Edition)
 Visualize This: The FlowingData Guide to Design, Visualization, and Statistics (2nd Edition)
New tools, refined process.
Browse by Chart Type See All →


