Imagine points for each piece on a chessboard. They move to x-y positions…
Santiago Ortiz
-

Famous chess matches visualized as 3-D wireframes
-
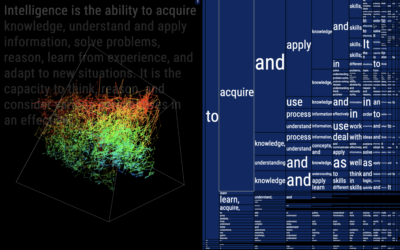
Visualizing the statistical connections behind ChatGPT
To gain a better understanding of how ChatGPT works under the hood, Santiago…
-
Friend simulation system, with ChatGPT
Philippe Vandenbroeck and Santiago Ortiz were curious about a system that incorporated knowledge…
-
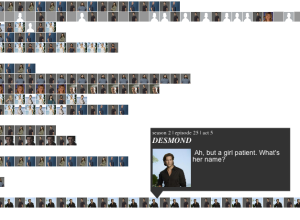
Every Lost episode visualized and recreated
Santiago Ortiz visualized every episode of the show in the interactive Lostalgic. It’s…
-
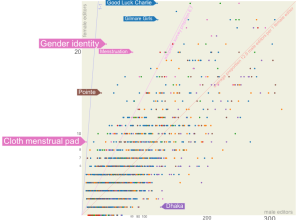
Wikipedia is dominated by male editors
After he saw a New York Times article on the gender gap among…
-

An interactive view of star constellations
When we look up at the night sky to gaze at the stars,…
-
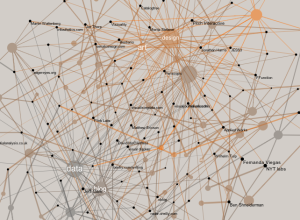
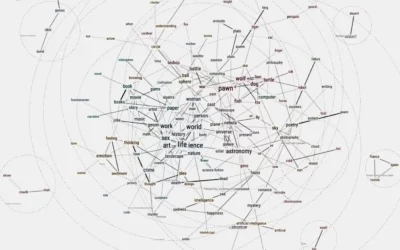
Network of data visualization references
Developer Santiago Ortiz explores visualization references through Delicious tags and puts them in…
-
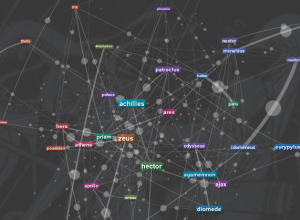
Character relationships in the Iliad
The Iliad is an epic poem by Homer with a lot of characters…
Recently for Members
Second Edition
 Visualize This: The FlowingData Guide to Design, Visualization, and Statistics (2nd Edition)
 Visualize This: The FlowingData Guide to Design, Visualization, and Statistics (2nd Edition)
New tools, refined process.
Browse by Chart Type See All →


