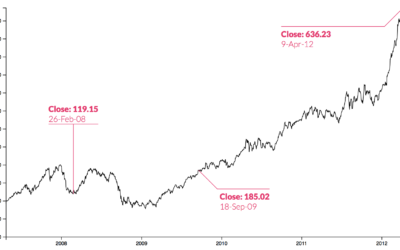
Annette Manes, a retired widow and single mother who saved by spending little,…
annotation
-
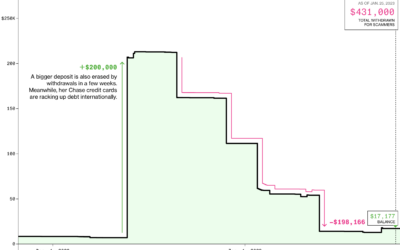
Scammed out of life savings, a line chart
-
Members Only
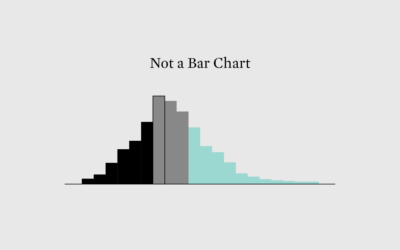
Histograms for Regular People
People need a sense of how distributions work before they can make sense of a histogram. Here’s how I (try to) make these misunderstood charts easier to read.
-
Members Only
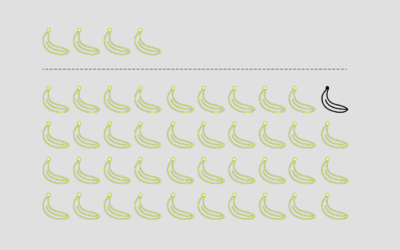
Ambiguous Units of Measurement
It’s better to err on the side of obvious than leave things ambiguous.
-
Members Only
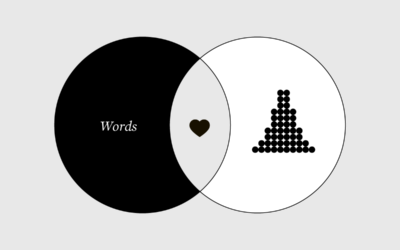
Uncertain Words and Uncertain Visualization, Better Together
People’s interpretation of a chart can change if you use differents words to describe it, even if the data stays the same.
-
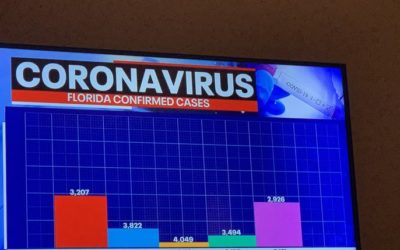
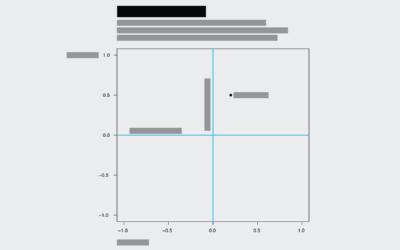
Bad bar chart
Welcome to whose bar chart is it anyway: where the geometries are made…
-
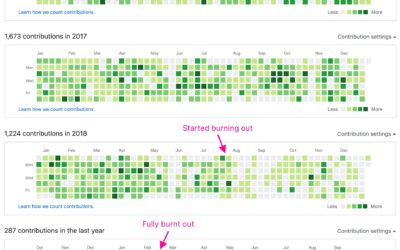
GitHub contribution graph to show burnout
A quick annotation by Jonnie Hallman on Twitter: “GitHub is really good at…
-
Members Only
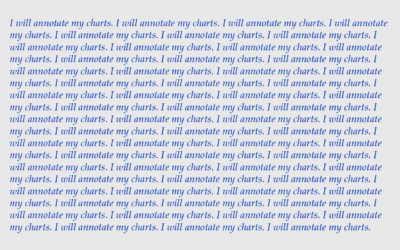
Annotate Charts to Help Your Data Speak, Because the Data Has No Idea What It Is Doing (The Process #52)
This week, we talk annotation and how it can make your charts more readable and easier to understand.
-
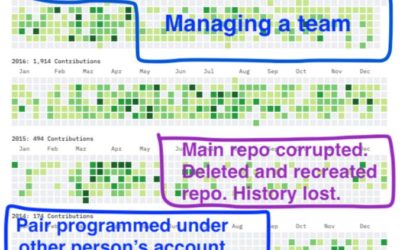
GitHub is meant to track code
Jen Luker noted, “As amazing as @github is, it is a tool designed…
-
Link
Automatic label placement along path →
Noah Veltman refined his label placement method, particularly useful for area graphs.
-
Link
d3-annotation 2.0 →
Next iteration of library for annotation. Made me delve into d3.js v4.
-
Making annotation easier with d3.js
There are two main reasons annotation is often a challenge. The first is…
-
Annotate charts with a few clicks using ChartAccent
Some say annotation is the most important layer for charts meant for public…
-
Members Only
Annotating Charts in R
Let the data speak for itself they say. That doesn’t work a lot of the time, and when that happens, you need to explain.
-
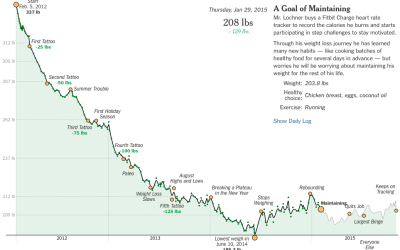
Food tracker diary timeline
With the availability of weight and food tracking apps these days, there are…
-
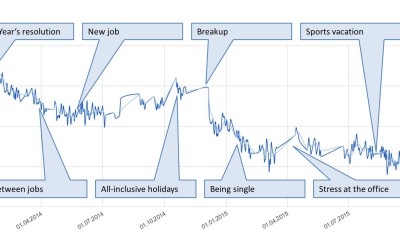
Weight loss and life events
Reddit user superemmjay tracked his weight for 20 months and plotted the measurements.…
-
Analysis versus storytelling
Robert Kosara contrasts my version of the pay gap graphic with the NYT…
Recently for Members
Second Edition
 Visualize This: The FlowingData Guide to Design, Visualization, and Statistics (2nd Edition)
 Visualize This: The FlowingData Guide to Design, Visualization, and Statistics (2nd Edition)
New tools, refined process.
Browse by Chart Type See All →


