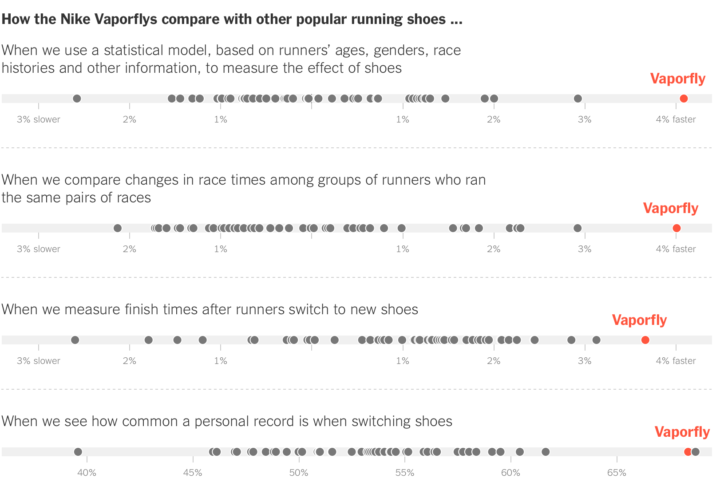
• Membership
  • Newsletter
  • Projects
  • Learning
  • About
  • Member Login
  • Secret army bases seen in public fitness tracking map

    January 31, 2018

    Topic

    Data Sharing  /  military, privacy, Strava

    Last year, fitness tracking app Strava released a high detail map of public activity data. Looking more closely, security student Nathan Ruser noticed activity in various parts of the globe that revealed secret US army bases.
    Read More

  • Guides  /  missing data

    Visualizing Incomplete and Missing Data

    We love complete and nicely formatted data. That’s not what we get a lot of the time.

    Read More
  • Finding fake followers

    January 29, 2018

    Topic

    Statistical Visualization  /  bot, fake, Twitter

    This fake follower piece by Nicholas Confessore, Gabriel J.X. Dance, Richard Harris, and Mark Hansen for The New York Times is tops. In search of shortcuts to greater influence, many buy followers, likes, and retweets on Twitter. The numbers go up, but a lot of extra “influence” is just automated fluff.

    The Times focuses on one company, Devumi, and investigates the follower pattern of some of the customers, as shown above. The scroll-y explanation is good. It’s even got pseudocode in there to explain the type of bots.

    Good stuff.

  • Hand-drawn how-to instructions using zero words

    January 29, 2018

    Topic

    Infographics  /  illustration, postcards

    Inspired by Dear Data, the data drawing pen pal project, designers Josefina Bravo, Sol Kawage, and Tomoko Furukawa use the postcard medium to send each other weekly how-to instructions for a wide variety of everyday things. The only rule is that they can’t use words.

    As of writing this, they’re on week 37, which covered how to roll maki, how to eat an apple like a boss, and how to make mayonnaise.

  • Release strategies for Oscar-nominated films

    January 26, 2018

    Topic

    Statistical Visualization  /  movies, Oscars

    Evie Liu and William Davis, reporting MarketWatch, looked at release strategies of Oscar nominees over the past few years. Some go for the wide release with the movie playing in over 1,500 theaters, whereas others choose a platform release with the movie playing in fewer than 50 theaters. The last seven of eight Best Picture winners went with the latter route.

  • Is there something wrong with democracy?

    January 25, 2018

    Topic

    Infographics  /  democracy, New York Times

    Max Fisher and Amanda Taub, for The New York Times, answer the question with a video and charts. And if you’re wondering how they generated a high resolution chart to video, Adam Pearce has you covered.

  • World population estimator and gridded data from NASA

    January 24, 2018

    Topic

    Data Sources  /  NASA, population

    Population data typically comes in the context of boundaries. City data. County data. Country data. With their Population Estimate Service, NASA provides data at higher granularity. You can request estimated population in the context of a world grid.

    Here’s an interactive map to demonstrate the API. Click and drag a shape across any region in the world and get an estimate of the population within that shape. [via kottke]

  • Data Underload  /  demographics

    The Demographics of Others

    I think we can all benefit from knowing a little more about others these days. This is a glimpse of how different groups live.

    Read More
  • Surprise, the world was warmer again in 2017

    January 22, 2018

    Topic

    Statistical Visualization  /  environment, global warming, New York Times

    According to NASA estimates, 2017 was the second warmest year on record since 1880. Henry Fountain, Jugal K. Patel, and Nadja Popovich reporting for The New York Times:

    What made the numbers unexpected was that last year had no El Niño, a shift in tropical Pacific weather patterns that is usually linked to record-setting heat and that contributed to record highs the previous two years. In fact, last year should have benefited from a weak version of the opposite phenomenon, La Niña, which is generally associated with lower atmospheric temperatures.

    Good times ahead.

  • Data to identify Wikipedia rabbit holes

    January 22, 2018

    Topic

    Data Sources  /  Wikipedia

    New data dump from the Wikimedia Foundation:

    The Wikimedia Foundation’s Analytics team is releasing a monthly clickstream dataset. The dataset represents—in aggregate—how readers reach a Wikipedia article and navigate to the next. Previously published as a static release, this dataset is now available as a series of monthly data dumps for English, Russian, German, Spanish, and Japanese Wikipedias.

  • Porn traffic before and after the missile alert in Hawaii

    January 19, 2018

    Topic

    Infographics  /  missile, porn

    PornHub compared minute-to-minute traffic on their site before and after the missile alert to an average Saturday (okay for work). Right after the alert there was a dip as people rushed for shelter, but not long after the false alarm notice, traffic appears to spike.

    Some interpret this as people rushed to porn after learning that a missile was not headed towards their home. Maybe that’s part of the reason, but my guess is that Saturday morning porn consumers woke earlier than usual.

  • Compare your fears against reality

    January 18, 2018

    Topic

    Infographics  /  fear

    From ABC News, this is a clever comparison between people’s worst fears and the number of deaths caused by the things that people fear. It starts by getting the reader to think about his or her fears and then places them in the context of causes of death.

  • Musical hexagons

    January 17, 2018

    Topic

    Statistical Visualization  /  music

    This is a fun ditty by Vasco Asturiano. I’m a little too far out from my eighth grade jazz band days, but it’s still fun to mess around with. Notes can be arranged in different ways, and then you just mouse over the hexagons to play.

  • Back to the Future, Abridged Chart Edition

    January 16, 2018

    Topic

    Chart Everything  /  Back to the Future, movie
  • Mapping global accessibility to cities

    January 15, 2018

    Topic

    Maps  /  accessibility, mobility

    From The Malaria Atlas Project, a global map of estimated accessibility to cities:

    In the present study, we quantify and validate global accessibility to high-density urban centres at a resolution of 1×1 kilometre for 2015, as measured by travel time. The last global mapping effort to measure accessibility was for the year 2000, a time that predates both substantial investment and expansion of transportation infrastructure and an extraordinary improvement in the data quantity and quality of accessibility measures. The game-changing improvement underpinning this work is the first-ever, global-scale synthesis of two leading roads datasets – Open Street Map (OSM) data and distance-to-roads data derived from the Google roads database – which resulted in a nearly five-fold increase in the mapped road area relative to that used to produce the circa 2000 map.

    The dark areas are the most fascinating.

  • Statistical detection of potential child abuse cases

    January 12, 2018

    Topic

    Statistics  /  algorithm, police

    Dan Hurley, reporting for The New York Times, describes the use of statistical software to assist call screeners:

    [T]he decision to screen out or in was not Byrne’s alone. In August 2016, Allegheny County became the first jurisdiction in the United States, or anywhere else, to let a predictive-analytics algorithm — the same kind of sophisticated pattern analysis used in credit reports, the automated buying and selling of stocks and the hiring, firing and fielding of baseball players on World Series-winning teams — offer up a second opinion on every incoming call, in hopes of doing a better job of identifying the families most in need of intervention. And so Byrne’s final step in assessing the call was to click on the icon of the Allegheny Family Screening Tool.

    I’m glad Hurley highlights the challenges of the inherent biases in the data and the algorithms later in the article. It’s one thing to use data to estimate player value in sports. It’s another thing to use data to decide whether or not to send help to someone calling the police. [Thanks, Jennifer]

  • Scale comparison of wildfires

    January 12, 2018

    Topic

    Maps  /  California, fires, scale, Washington Post

    The past few days in California has been non-stop rain, but the months before that, there was unprecedented wildfires in the state. Lauren Tierney, reporting for The Washington Post, provides an overview along with a scale comparison of 2017’s biggest fire against anywhere on the globe.

  • When data is not quite what it seems

    January 11, 2018

    Topic

    Mistaken Data  /  artificial intelligence, missing data

    FiveThirtyEight used a dataset on broadband as the basis for a couple of stories. The data appears to be flawed, which makes for a flawed analysis. From their post mortem:

    We should have been more careful in how we used the data to help guide where to report out our stories on inadequate internet, and we were reminded of an important lesson: that just because a data set comes from reputable institutions doesn’t necessarily mean it’s reliable.

    Then, from Andrew Gelman and Michael Maltz, there was the closer look at data collected by the Murder Accountability Project, which has its merits but also some holes:

    if you’re automatically sifting through data, you have to be concerned with data quality, with the relation between the numbers in your computer and the underlying reality they are supposed to represent. In this case, we’re concerned, given that we did not trawl through the visualizations looking for mistakes; rather, we found a problem in the very first place we looked.

    There’s also the ChestXray14 dataset, which is a large set of x-rays used to train medical artificial intelligence systems. Radiologist Luke Oakden-Rayner looked closer, and the dataset appears to have its issues as well:

    In my opinion, this paper should have spent more time explaining the dataset. Particularly given the fact that many of the data users will be computer scientists without the clinical knowledge to discover any pitfalls. Instead, the paper describes text mining and computer vision tasks. There is one paragraph (in eight pages), and one table, about the accuracy of their labeling.

    For data analysis to be meaningful, for it to actually work, you need that first part to be legit. The data. If the data collection process rates poorly, missing data outnumbers observations, or computer-generated estimates aren’t vetted by a person, then there’s a good chance anything you do afterwards produces questionable results.

    Obviously this isn’t to say avoid data altogether. Every abstraction of real life comes with its pros and cons. Just don’t assume too much about a dataset before you examine it.

  • How to Make Venn Diagrams in R

    The usually abstract, qualitative and sometimes quantitative chart type shows relationships. You can make them in R, if you must.

  • When the interesting pattern ends up just being computer byproduct

    January 10, 2018

    Topic

    Mistaken Data  /  receipt, shopping

    Good lesson here. Christian Laesser was playing around with receipt data and initially thought he had a fun pattern at hand. It looked like the shopper always put things in his or her cart in the same order every time. It turns out though that the order just came from the computer ordering items by category. It had nothing to do with shopping order.

    Familiarize yourself with your data source before you go deep diving for insights.

  • Page 148 of 391
  • <
  • 1
  • ...
  • 145
  • 146
  • 147
  • 148
  • 149
  • 150
  • ...
  • 391
  • >

Analyze, visualize, and communicate data usefully, beyond the defaults.

Become a member →

Recently for Members

May 8, 2025
When the data is not what it seems

May 1, 2025
Finding the Right Charts

April 24, 2025
Visualization Tools, Datasets, and Resources – April 2025 Roundup

April 17, 2025
Breaking Out of Chart Software Defaults

April 15, 2025
Line Chart with Decorative Neon Accents

Browse by Chart Type See All →

Pictogram Heatmap Stacked Bar Chart Dot Map Area Chart Slope Chart Baseline Chart Packed Bubble Chart Small Multiples Parallel Sets

Browse By Topic

  • Visualization

    Seeing data

  • Maps

    Seeing geographic data

  • Infographics

    Explaining data

  • Networks

    Connecting data

  • Statistics

    Analyzing data

  • Software

    Working with data

  • Sources

    Getting data

  • Design

    Making data readable

Get the Book

Visualize This: The FlowingData Guide to Design, Visualization, and Statistics

Available now.

Order: Amazon / Bookshop

Made by FlowingData

  • The Process

  • Data Underload

  • Chart Everything

  • Guides

  • Books

  • Shop

  • About
  • Contact
  • Newsletter
  • LinkedIn
  • Instagram
  • Bluesky
  • RSS
Copyright © 2007-Present FlowingData. All rights reserved.