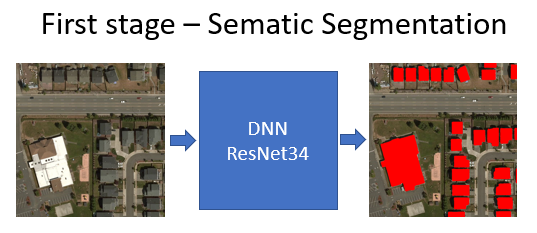
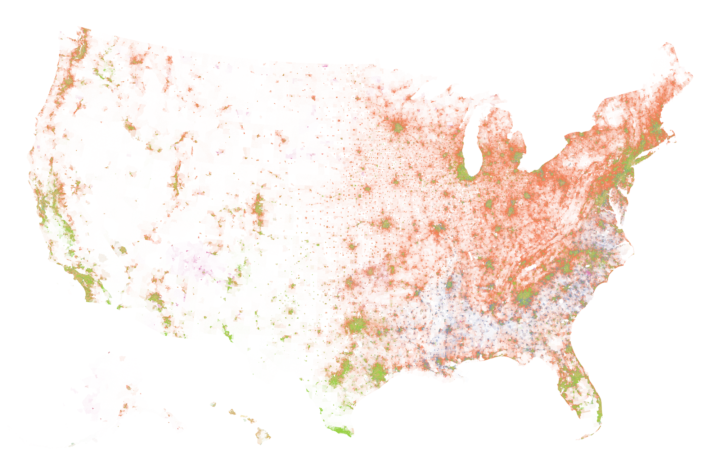
• Membership
  • Newsletter
  • Projects
  • Learning
  • About
  • Member Login
  • Unconstitutional gerrymandering

    January 9, 2018

    Topic

    Statistics  /  gerrymandering

    Alan Blinder and Michael Wines reporting for The New York Times:

    A panel of federal judges struck down North Carolina’s congressional map on Tuesday, condemning it as unconstitutional because Republicans had drawn the map seeking a political advantage.

    The ruling was the first time that a federal court had blocked a congressional map because of a partisan gerrymander, and it instantly endangered Republican seats in the coming elections.

    Go math.

  • Spotting rip currents

    January 9, 2018

    Topic

    Infographics  /  ocean

    Rip currents are like hidden rivers near the shore that head out to sea. An unexperienced swimmer or surfer can get caught in one, panic, and drown. So The Sydney Morning Herald put together a guide on how to spot rips. The mix of video and graphics makes things more clear, as they better represent what people will actually see at the beach. And the overheads for many major beaches in Australia are also helpful. [Thanks, Neville]

  • Guides  /  uncertainty

    Visualizing the Uncertainty in Data

    Data is an abstraction, and it’s impossible to encapsulate everything it represents in real life. So there is uncertainty. Here are ways to visualize the uncertainty.

    Read More
  • Obliteration Room invited people to put dotted stickers everywhere

    January 5, 2018

    Topic

    Data Art  /  dots

    The Obliteration Room (2012) by artist Yayoi Kusama started as a blank white room and ended as a room completely covered by dotted stickers.

    [arve url=”https://www.youtube.com/watch?v=-xNzr-fJHQw” /]

    It’s like the early stages of a Reddit April Fool’s joke.

  • Where athletes in professional sports come from

    January 4, 2018

    Topic

    Statistical Visualization  /  sports, Upshot

    Sports are growing more international with respect to the athletes. Gregor Aisch, Kevin Quealy, and Rory Smith for The Upshot show by how much, with a focus on leagues in Europe and North America.

    I like how: The dominant home country in each chart doubles as background and a layer; the tooltip shades the country you moused over while still showing the other countries; and the missing data and gaps are shown clearly but don’t obstruct the overall view.

  • Field Guide to the R Ecosystem

    January 3, 2018

    Topic

    Coding  /  R

    If you’re looking to acquaint yourself with R — the non-coding aspects of the language — the brief Field Guide to the R Ecosystem by Mark Sellers might help.

    Perhaps, you’re a hobbyist R user, who’d like to provide more information to your company in order to make a case for adopting R? Maybe you’re part of a support team who’ll be building out infrastructure to support R in your business, but don’t know the first thing about R. You might be a manager or executive keen to support the development of an advanced analytics capability within your organisation. In all of these cases, the field guide should be useful to you.

    Useful.

    If you want to learn coding with R though, get into tutorials and examples, and you pick up the stuff in this guide in the process of learning.

  • Most popular GIFs used to express emotion in different countries

    January 3, 2018

    Topic

    Infographics  /  emotion, GIF, Upshot

    People often use animated GIFs to digitally express caricatures of emotion or reaction. So when you look at the most distinct ones of various countries associated with specific emotions, you get sort of a caricature for each region. Amanda Hess and Quoctrung Bui for The Upshot looked.

    I wonder what the GIFs look like for people who are less likely to display emotion. Does the straight face cross over to GIF usage, or is there a dichotomy of real-life and digital self? I must know.

  • Mapping perceived canopy tree cover in major cities

    January 2, 2018

    Topic

    Maps  /  city, environment, trees

    Treepedia, from the MIT Senseable City Lab, estimates perceived tree cover at the street level. They used panorama views from Google Street View to form a “Green View Index”, which they then mapped for major cities.

    Treepedia measures the canopy cover in cities. Rather than count the individual number of trees, we’ve developed a scaleable and universally applicable method by analyzing the amount of green perceived while walking down the street. The visualization maps street-level perception only, so your favorite parks aren’t included! Presented here is preliminary selection of global cities.

  • Time-lapse shows night sky at varying levels of light pollution

    December 29, 2017

    Topic

    Data Art  /  light, pollution, time-lapse

    One of my favorite childhood memories is the time I went camping and saw the Big Dipper for the first time. There weren’t any lights in the mountains to diffuse the view of the sky. Sriram Murali uses time-lapse to demonstrate. Queue the ethereal music:

    [arve url=”https://www.youtube.com/watch?v=doHVMJnuvDA” /]

    [via kottke]

  • Visualization  /  best-of

    10 Best Data Visualization Projects of 2017

    It was a rough year, which brought about a lot of good work. Here are my favorite data visualization projects of the year.

    Read More
  • Charting all the major California wildfires since 2000

    December 28, 2017

    Topic

    Statistical Visualization  /  Axios, fire

    Based on data from CAL FIRE, Erin Ross, for Axios, plotted California wildfires that spanned at least 300 acres since 2000. Each triangle represents a fire, where the height represents acres burned (width is the same for all triangles) and color represents duration. The fires appear to be burning hotter and longer.

    I wonder if it’s worth doubling up on the triangle encoding by using width to represent duration, similar to the Washington Post graphic made during the elections.

  • Getty Center fire resistance

    December 28, 2017

    Topic

    Infographics  /  fire, Getty, Los Angeles, New York Times

    Fire spread over Los Angeles, but the famous art works in the Getty Center stayed put. John Schwartz and Guilbert Gates reporting for The New York Times:

    The Getty’s architect, Richard Meier, built fire resistance into the billion-dollar complex, said Ron Hartwig, vice president of communications for the J. Paul Getty Trust. These hills are fire prone, but because of features like the 1.2 million square feet of thick travertine stone covering the outside walls, the crushed rock on the roofs and even the plants chosen for the brush-cleared grounds, “The safest place for the artwork to be is right here in the Getty Center,” he said.

    It’s a short visual piece, but I found the forethought in building design and the straightforward graphics fascinating.

  • Family displacements through urban renewal

    December 27, 2017

    Topic

    Maps  /  family, urban

    Hundreds of thousands of families were displaced in the 1950s under “urban renewal” programs. The families were disproportionately minorities. Renewing Inequality, from a research group at the University of Richmond’s Digital Scholarship Lab, revisits the topic and how it reflects in the present.

    Renewing Inequality presents a newly comprehensive vantage point on mid-twentieth-century America: the expanding role of the federal government in the public and private redevelopment of cities and the perpetuation of racial and spatial inequalities. It offers the most comprehensive and unified set of national and local data on the federal Urban Renewal program, a World War II-era urban policy that fundamentally reshaped large and small cities well into the 1970s.

    Many of the people displaced never receive promised compensation or fair market value for their property, which is kind of messed up.

    Learn.

  • Alternatives to the rainbow color scale

    December 26, 2017

    Topic

    Design  /  color, rainbow

    Oh. It’s that time of year already. Time to hate on the rainbow color scale, which is still prevalent but equally less useful than alternatives. Matt Hall provides (scientific!) reasons for looking to scales that don’t include the full spectrum and some solutions.

    We know what kind of colourmaps are good for interpretation: those that increase linearly and monotonically in brightness, with no jumps or stripes of luminance. I’ve linked to lots of places where you can read about these — see the end of the post. You already know one perceptual colourmap: the humble Greyscale. But there are lots of others, so let’s start with one of them.

  • Q&A with Di Cook

    December 22, 2017

    Topic

    Statistics  /  Di Cook, teaching

    Statistics professor Di Cook was one of the first people I ever talked to about visualization. She has a short Q&A over at StatsChat.

    I spent a few years doing that [a research assistant] and then realised I’d really like to make art, because some of the research-assistant work I was doing was computer graphics for data online. It fed into my art instincts from teenage years, so I spent some time as an artist before finding a graduate programme in statistics in the US that focused on data visualisation.

  • Introduction to regular expressions

    December 22, 2017

    Topic

    Coding  /  regular expression

    If you want to analyze bodies of text, it’s a good to know how to use regular expressions. That way you can programmatically extract complex text patterns instead of marking and encoding items manually. Thomas Nield for O’Reilly provides an introduction:

    Many data science, analyst, and technology professionals have encountered regular expressions at some point. This esoteric, miniature language is used for matching complex text patterns, and looks mysterious and intimidating at first. However, regular expressions (also called “regex”) are a powerful tool that only require a small time investment to learn. They are almost ubiquitously supported wherever there is data.

    Nield says it isn’t a steep learning curve, which I agree with, but I would suggest not trying to learn every part of the syntax. Learn it piecewise, and it’ll seem like less of a jumble of brackets, periods, and question marks.

    See also the RegExr. It’s an interactive tool that lets you paste a body of text and then enter regular expressions to see what matches your given pattern in real-time.

  • Ed Sheeran’s creative process explained with music visualization

    December 21, 2017

    Topic

    Data Art  /  Ed Sheeran, music, New York Times

    The New York Times is back at it in explaining the creative process. A couple of years ago they explained the making of a Justin Bieber song. This time they talked to Ed Sheeran and his collaborators about the making of their hit song Shape of You. The musicians talk and the visualization serves as a backdrop.

    [arve url=”https://www.youtube.com/watch?v=ZpMNJbt3QDE” /]

  • How machines learn

    December 20, 2017

    Topic

    Statistics  /  algorithm, explainer, machine learning

    Hearing about machine learning and algorithms a lot recently and not sure what that means? CGP Grey explains:

    [arve url=”https://www.youtube.com/watch?v=R9OHn5ZF4Uo” /]

  • Page 149 of 391
  • <
  • 1
  • ...
  • 146
  • 147
  • 148
  • 149
  • 150
  • 151
  • ...
  • 391
  • >

Analyze, visualize, and communicate data usefully, beyond the defaults.

Become a member →

Recently for Members

May 8, 2025
When the data is not what it seems

May 1, 2025
Finding the Right Charts

April 24, 2025
Visualization Tools, Datasets, and Resources – April 2025 Roundup

April 17, 2025
Breaking Out of Chart Software Defaults

April 15, 2025
Line Chart with Decorative Neon Accents

Browse by Chart Type See All →

Glyph Chart Spike Map Variable Width Bar Chart Pie Chart Frequency Trails Stacked Bar Chart Small Multiples Network Graph Slope Chart Surface Plot

Browse By Topic

  • Visualization

    Seeing data

  • Maps

    Seeing geographic data

  • Infographics

    Explaining data

  • Networks

    Connecting data

  • Statistics

    Analyzing data

  • Software

    Working with data

  • Sources

    Getting data

  • Design

    Making data readable

Get the Book

Visualize This: The FlowingData Guide to Design, Visualization, and Statistics

Available now.

Order: Amazon / Bookshop

Made by FlowingData

  • The Process

  • Data Underload

  • Chart Everything

  • Guides

  • Books

  • Shop

  • About
  • Contact
  • Newsletter
  • LinkedIn
  • Instagram
  • Bluesky
  • RSS
Copyright © 2007-Present FlowingData. All rights reserved.