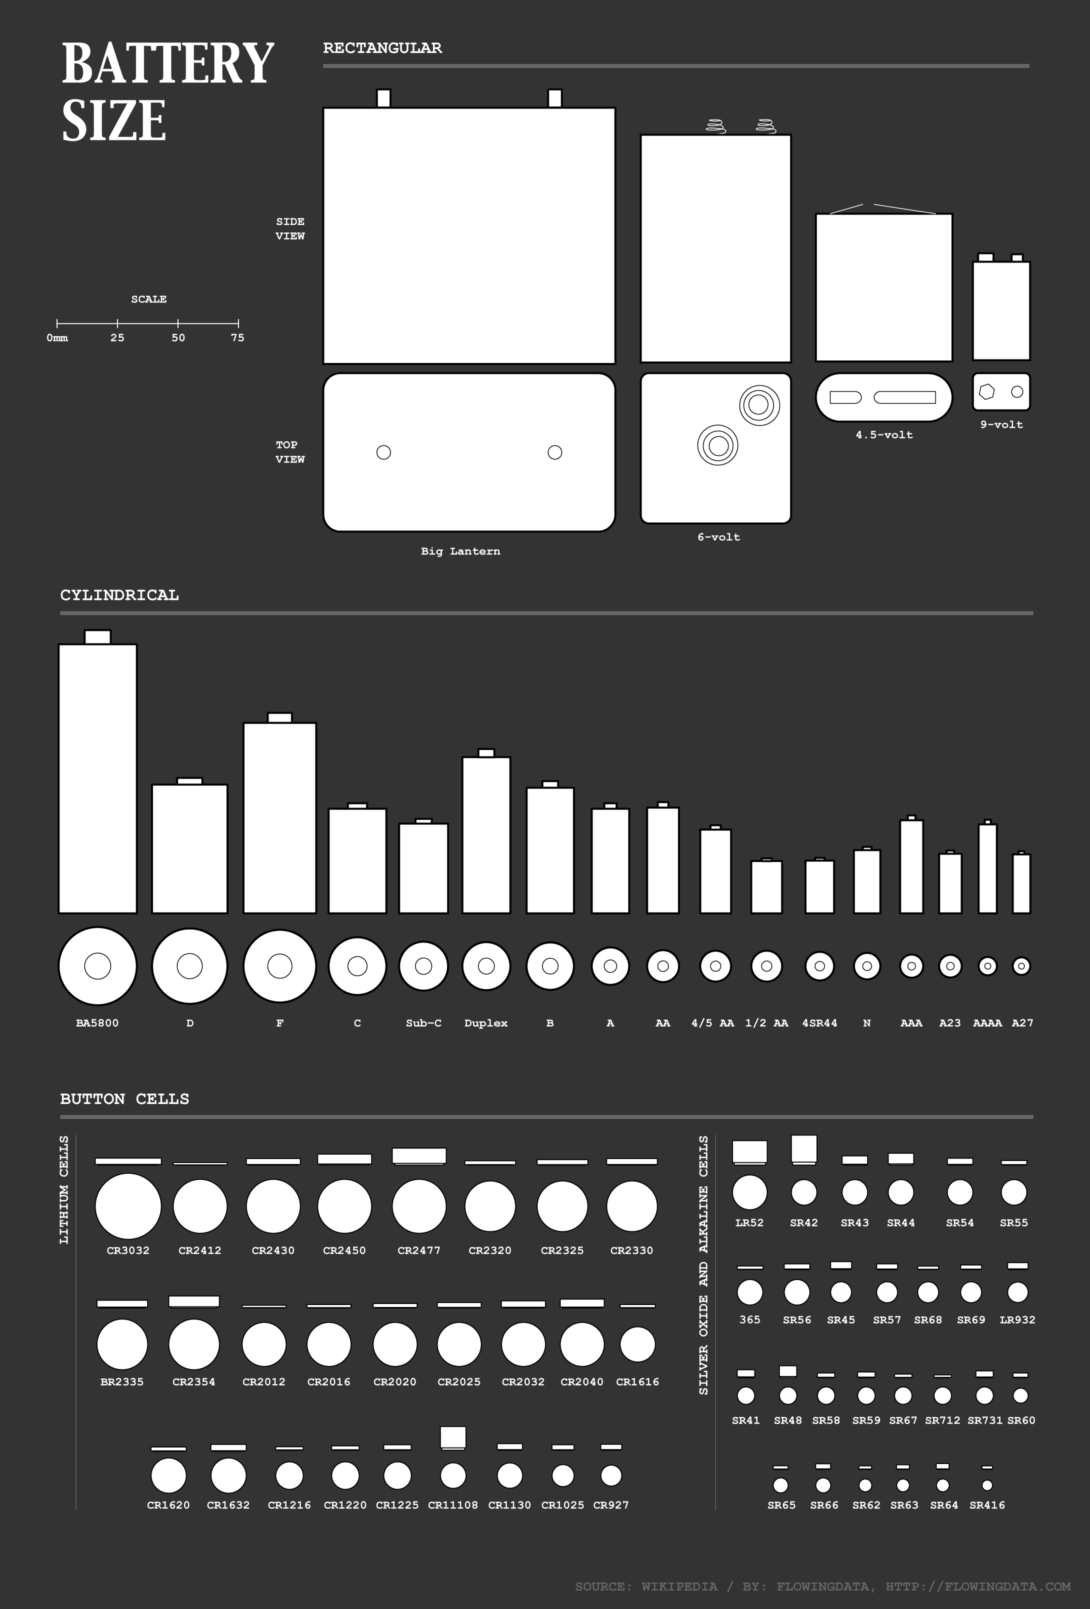
A Diagram of All the Batteries

If parenthood has taught me anything, it’s that when your kid’s toy needs a battery, you will not have the right size. This is a simple fact of life.

In the most recent challenge to this pillar of truth, a Gekko toy (from the show PJ Masks, obviously) needed a button cell battery. I dug into my battery drawer — a reflection of toys past — naively thinking that I must have the right size. The excavation showed that I was in fact incorrect.

The natural next step was of course to look up battery sizes and chart all of them.

Notes

Become a member. Support an independent site. Make great charts.

See What You Get

Learn to Visualize Data See All →

3-D Printing: How to Prepare the Data in R

Moving your data from the digital screen to something more physical isn’t as tricky as it seems. Here’s how I did it.

How to Make an Interactive Stacked Area Chart

Stacked area charts let you see categorical data over time. Interaction allows you to focus on specific categories without losing sight of the big picture.

A Course for Visualization in R, Taking You From Beginner to Advanced

Where to start? What to learn next? Here’s a course to help take you from beginner to advanced.

How to Untangle a Spaghetti Line Chart (with R Examples)

Put multiple time series lines on the same plot, and you quickly end up with a mess. Here are practical ways to clean it up.

Favorites

The Best Data Visualization Projects of 2011

I almost didn’t make a best-of list this year, but …

A Day in the Life: Women and Men

Using the past couple of years of data from the American Time Use Survey, I simulated a working day for men and women to see how schedules differ. Watch it play out in this animation.

Unemployment in America, Mapped Over Time

Watch the regional changes across the country from 1990 to 2016.

How You Will Die

So far we’ve seen when you will die and how other people tend to die. Now let’s put the two together to see how and when you will die, given your sex, race, and age.