Most of the major map providers changed the name. MapQuest had a different…
Nathan Yau
-
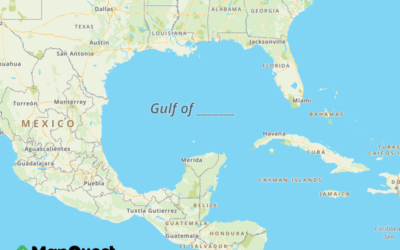
Gulf of wherever you want
-
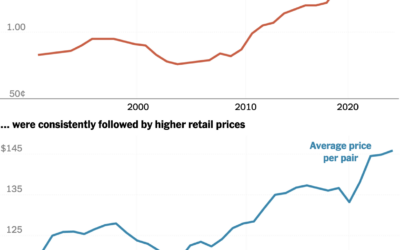
How tariffs work
I think I’ve read about tariffs more in the past month than I…
-
$8 billion was actually $8 million in DOGE mistake
The DOGE site has a “wall of receipts” that claims $55 billion in…
-
Members Only
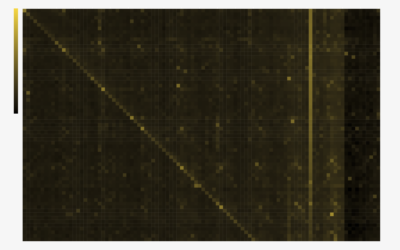
Heatmaps and Defining Color Scales
With color as the visual encoding, choose the scales that allow you to see actual patterns.
-
Charting data that might disappear soon
The administration continues its takedown of data that it doesn’t agree with. To…
-
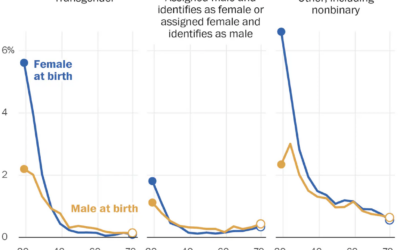
150-year-olds probably not receiving Social Security benefits
The Department of Government Efficiency claims data in the Social Security Administration database…
-
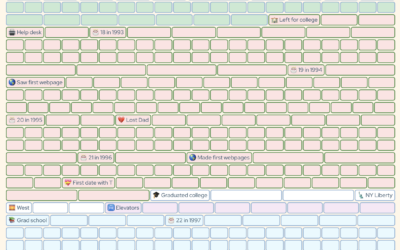
A life documented in weeks
Coming up on 50 years old, Gina Trapani mapped out her life so…
-
Open letter from former Census Bureau director
Robert Santos, who resigned last month, wrote a heartfelt open letter to Census…
-
DOGE wants access to IRS taxpayer data
For the Washington Post, Jacob Bogage and Jeff Stein report:
Under pressure from… -
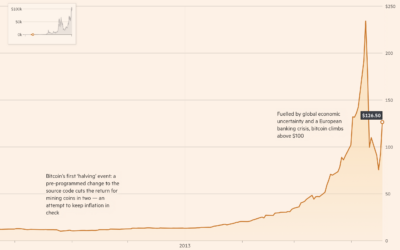
Rise and fall and rise again for bitcoin
There was a moment a few years ago when cryptocurrency was mentioned everywhere…
-

Possible field of vision from the helicopter seat
From the outsider point of view, a path towards collision might seem obvious,…
-
Members Only
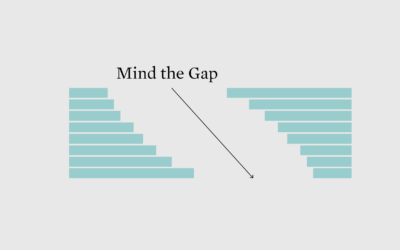
Designs for Missing/Changing Data
How do we visualize the data that isn’t there or new estimates that arise when methodology changes?
-

Defense Against Dishonest Charts
This is a guide to protect ourselves and to preserve what is good about turning data into visual things.
-

Golphe du Mexique, 1765
After a gulf rename, I got to browsing some historical maps. Jacques Nicolas…
-
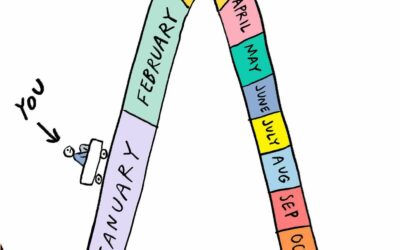
How time works
Cartoonist Becky Barnicoat illustrates the passing of time over a year. Seems right:…
-
Value of government data
While government data remains in limbo, for Slate, Lizzie O’Leary highlights the sectors…
-

Try to cut $2 trillion from the federal budget
The “Department of Government Efficiency” wants to cut $2 trillion from the federal…
-
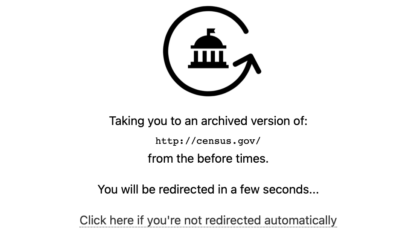
Access previous versions of government websites with GovWayback
You can use the Internet Archive to access historical versions, but GovWayback makes…
-
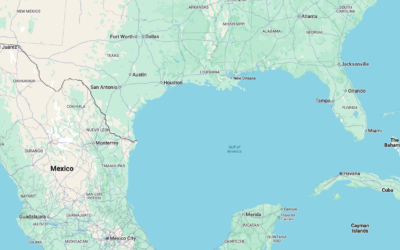
Gulf of Mexico changes to Gulf of America
The Gulf of Mexico has been renamed to the Gulf of America in…
-
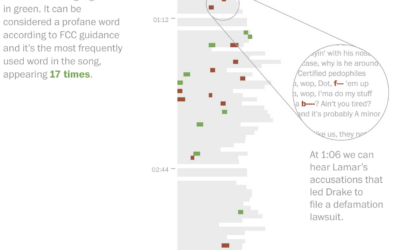
Leaving out keywords in a halftime show
I missed this one last week, pre-Super Bowl, but for The Washington Post,…
Recently for Members
Second Edition
 Visualize This: The FlowingData Guide to Design, Visualization, and Statistics (2nd Edition)
 Visualize This: The FlowingData Guide to Design, Visualization, and Statistics (2nd Edition)
New tools, refined process.
Browse by Chart Type See All →


