Last week, Disney laid off FiveThirtyEight employees and announced the site would cease…
teaching
-
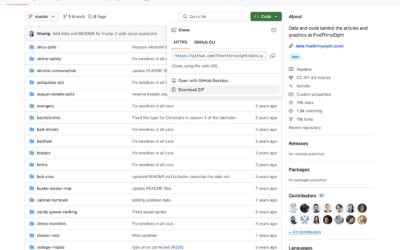
Access FiveThirtyEight resources while they’re still around
-
Members Only

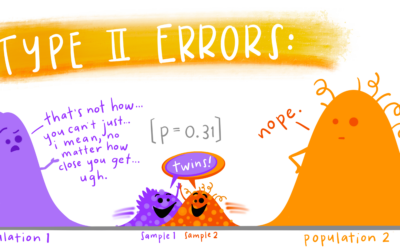
Explaining More, Assuming Less
You know what they say about assumptions.
-
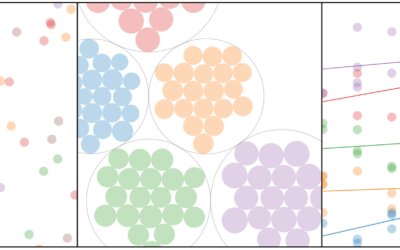
Educational statistics illustrations
Allison Horst often illustrates data science concepts and tools with anthropomorphized shapes and…
-
Catching students cheating with R
Matthew Crump, a psychology professor who discovered high volume cheating in his class…
-
Members Only

The Process 105 – Piecing Together the Basics
You gotta walk before you crawl. Wait a minute.
-
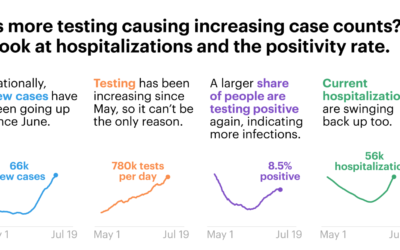
Understanding Covid-19 statistics
For ProPublica, Caroline Chen, with graphics by Ash Ngu, provides a guide on…
-

Teaching kids data visualization
Jonathan Schwabish gave his fourth-grade son’s class a lesson on data visualization. He…
-
Datasets for teaching data science
Rafael Irizarry introduces the dslabs package for real-life datasets to teach data science:…
-
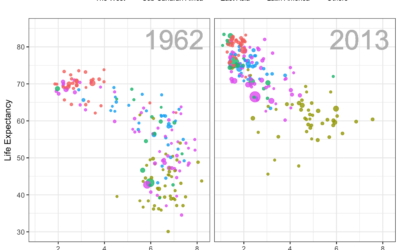
Q&A with Di Cook
Statistics professor Di Cook was one of the first people I ever talked…
-
Visual explainer for hierarchical modeling
Hierarchical models, or multilevel models, are used to represent data that might vary…
-
Data exploration banned
Statistician John Tukey, who coined Exploratory Data Analysis, talked a lot about using…
-
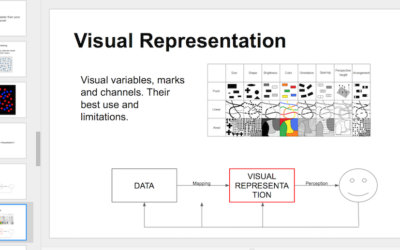
Teaching materials for visualization
Enrico Bertini, who has taught information visualization at New York University for the…
-
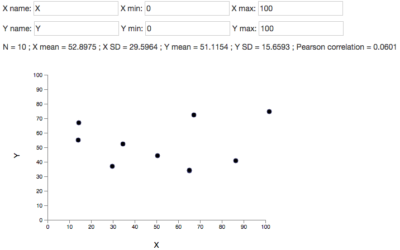
DrawMyData lets you plot points manually and then download the data
When you have graphs to draw or statistical concepts to teach, you need…
-
Teaching math through percussive dance
Malke Rosenfeld uses percussive dance to teach math to her elementary students. The…
-

Exponential water tank
Hibai Unzueta, based on a paper by Albert Bartlett, demonstrates exponential growth with…
-
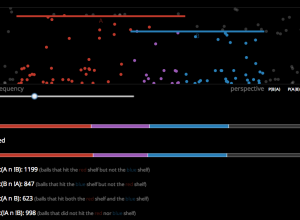
A visual explanation of conditional probability
Victor Powell, who has visualized the Central Limit Theorem and Simpson’s Paradox, most…
-
Link
Teaching 2nd Graders About Maps
Cartographer Gretchen Peterson taught 70 second graders about maps. She talks about her positive experience and the kids’ excitement and makes the OSM index cards she used in the class.
Recently for Members
Second Edition
 Visualize This: The FlowingData Guide to Design, Visualization, and Statistics (2nd Edition)
 Visualize This: The FlowingData Guide to Design, Visualization, and Statistics (2nd Edition)
New tools, refined process.
Browse by Chart Type See All →


