The Metropolitan Transportation Authority in New York is rolling out an updated subway…
Nathan Yau
-
NYC subway map updated with a diagrammatic style
-
IRS agrees to send immigrant tax data to ICE
For Associated Press, Fatima Hussein reports:
The acting commissioner of the Internal Revenue… -
Members Only
Zooming Out For Clarity
With data, we can zoom out. Gather context, get the big picture, and filter out the noise.
-
Anime.js, a JavaScript animation engine
New to me, Anime.js by Julian Garnier seems like a fun library to…
-
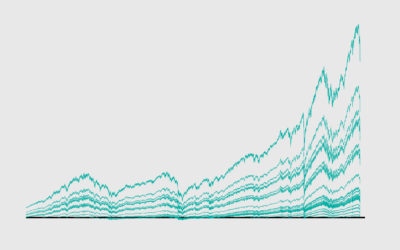
Stock Market Recovery Time, a Long-Term Perspective
Households are seeing the value of their savings decrease significantly over a short period of time. Now seems like a good time to take the long-term point of view.
-
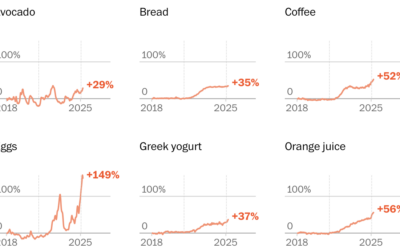
Inflation tracker for your backyard barbecue
Washington Post Opinion has a tracker updated weekly that groups items by everyday…
-
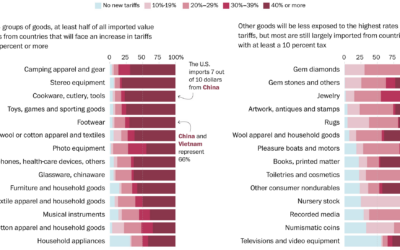
Tariff exposure for groups of goods
You get a tariff. And you get a tariff. And you. And you.…
-
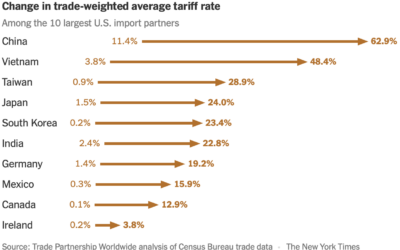
Increase in tariffs for each country
Trade Partnership Worldwide, based on data from the Census Bureau, estimates $714 billion…
-
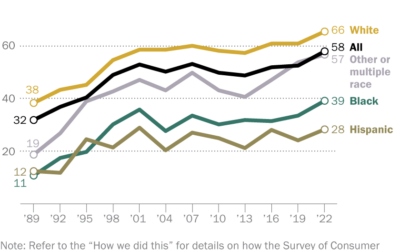
Families with money in the stock market
Based on data from the Survey of Consumer Finances, 58% of families have…
-
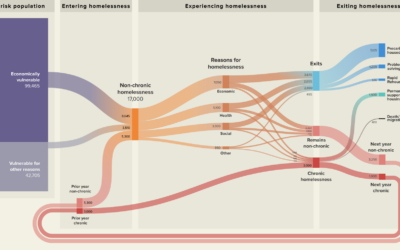
Visualized plans to reduce homelessness
With Streets to Stability, Crankstart illustrates a plan to reduce homelessness in San…
-
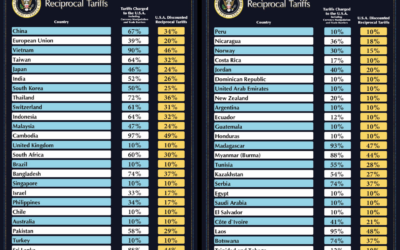
Simplified tariff calculations, ambiguously reciprocal
One might assume decisions that swing economies worldwide were based on careful research…
-
Members Only
Stack the Bars
When bars are stacked, we can see shifts in composition, but the layout can also make it harder to see patterns individually. Let’s look at our options.
-
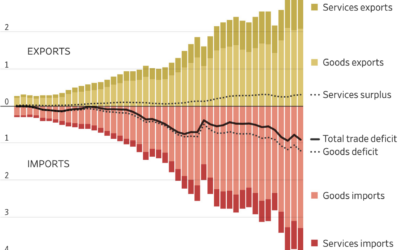
Trade imbalance explained with charts
The Wall Street Journal has a handful of charts that briefly explain trade…
-
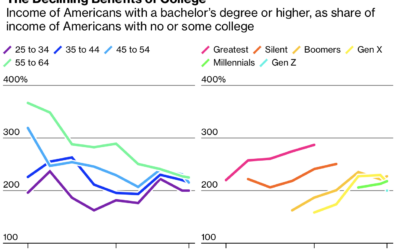
Changing income benefits between college and no college
As you might expect, there is a big income difference between those with…
-
Greatest two-hit wonders
Two-hit wonders are in between the obscure one-hit wonders and famous musicians. Chris…
-
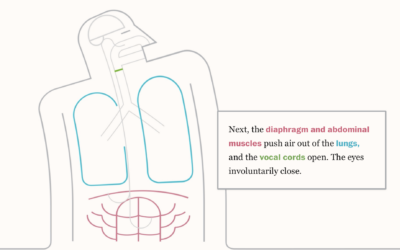
Science of the loud sneeze, illustrated
Some people sneeze very loudly. For the Washington Post, Teddy Amenabar, Álvaro Valiño,…
-
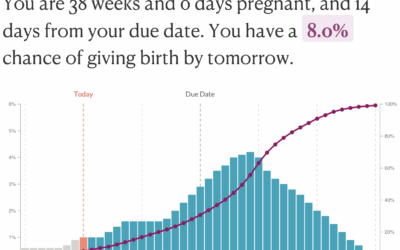
When the baby will be born
Maggie Appleton is at the point in her pregnancy when there’s a lot…
-
Economic impact of federal health research cuts
The Science & Community Impacts Mapping Project (SCIMap) estimates the impact of proposed…
-
History of slipping on banana peels
Secret Base offers a much too complete history of slipping on banana peels,…
-
Members Only
Visualization Tools, Datasets, and Resources – March 2025 Roundup
Here are tools you can use, data to play with, and resources to learn from that flew across my desk in March.








 Visualize This: The FlowingData Guide to Design, Visualization, and Statistics (2nd Edition)


