In what seems to have become a trend of making more and more…
election
-
Mapping all of the voters
-
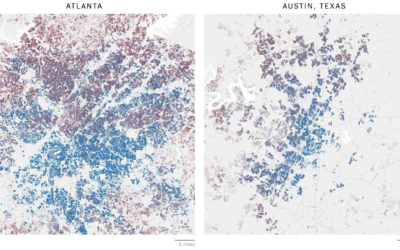
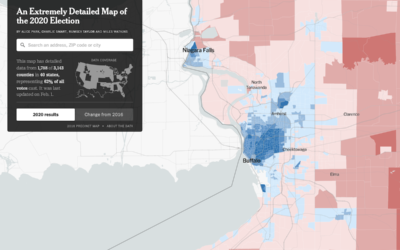
Precinct-level map of 2020 election results
NYT’s The Upshot published their precinct-level map of 2020 election results. Zoom in…
-
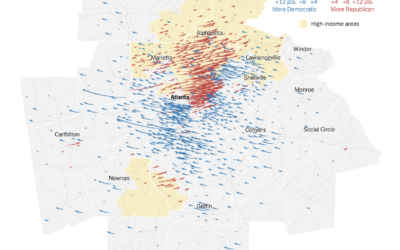
Map of the voting in Georgia, the runoff vs. the general election
For NYT’s The Upshot, Nate Cohn explains how Warnock and Ossoff won Georgia.…
-
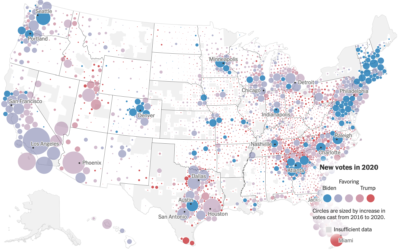
Voting gains for 2020, compared to 2016 election
For The New York Times, Ford Fessenden, Lazaro Gamio and Rich Harris go…
-
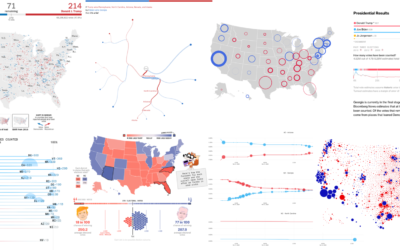
Recap of all the election maps and charts
Alan McConchie from Stamen recaps the wide array of maps and charts that…
-
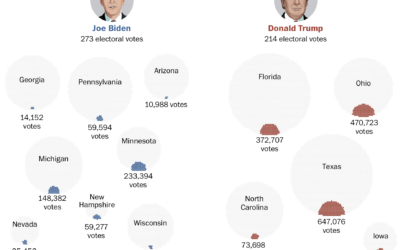
Votes that won the presidency
Voter turnout this election was higher than it’s been in a long time,…
-
Debunking claims of election rigging
There’s a video (one of too many I am sure) going around that…
-
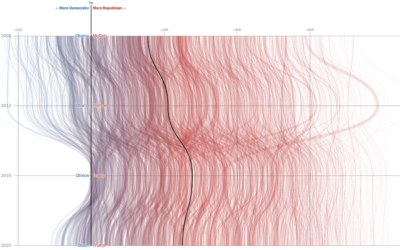
Red counties mostly stayed red
For The New York Times, Denise Lu and Karen Yourish looked at the…
-
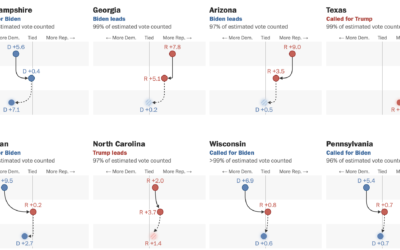
Swings in the battleground states
For The Washington Post, Ashlyn Still and Ted Mellnik show the shifts in…
-
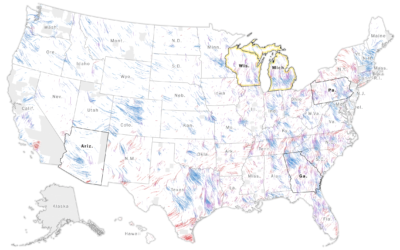
Wind map to show change in vote shares and participation
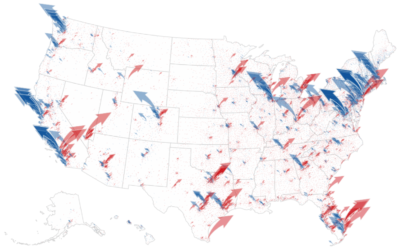
The Washington Post goes with a wind metaphor to show the change in…
-
Members Only
The Process 114 – Data, the Fuzzy and Fragile Representation of Real Life
As I’m sure you know, it was Election Day on Tuesday here in the United States. I told myself that I wouldn’t watch the results roll in, because the record number of mail-in ballots would throw off regular timelines. Of course I broke.
-
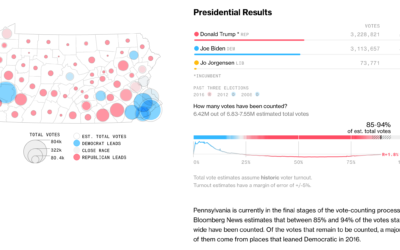
Watch the election percentages for votes counted so far
Still waiting for those results? Bloomberg’s election page for each state shows the…
-
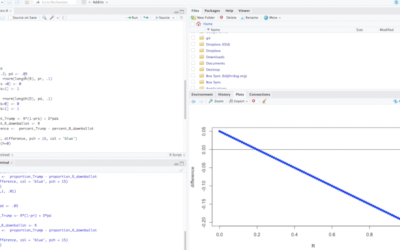
Testing voting scenarios while we wait for the counts
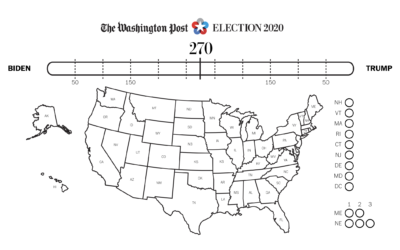
As we wait for the votes to be counted in the remaining states,…
-
Election needles are back
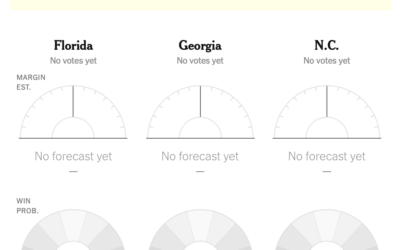
The NYT election needles of uncertainty are back, and they’re about to go…
-
Electoral coloring page
If you want to color in your own electoral map at home, The…
-
Early voting by state
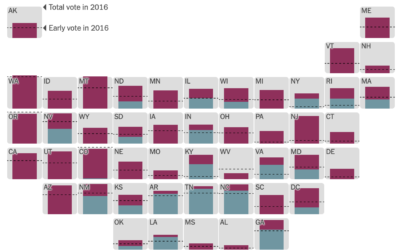
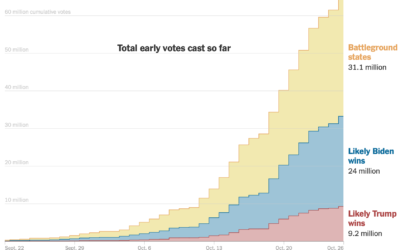
It’s election day here in the United States, but millions of votes have…
-
Comparing correlation in the FiveThirtyEight and Economist election forecasts
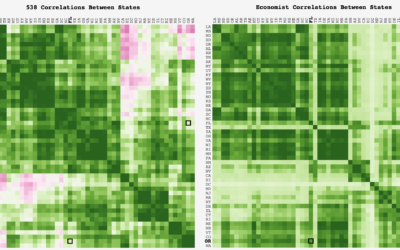
FiveThirtyEight and The Economist take similar inputs but output different forecasts. Adam Pearce…
-
Early voting volumes
As you might expect, early voting volume is high across the country. In…
-
Money raised for the presidential election – by geography, time, and demographic
The New York Times analyzed campaign finance data from April to October, mapping…
-
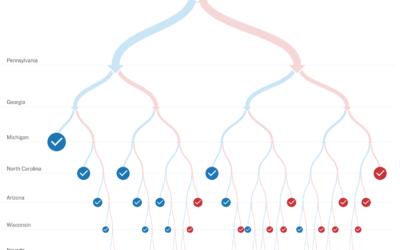
Decision tree for the presidential election result
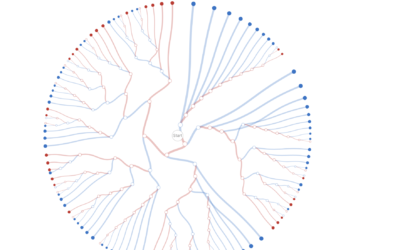
While we’re on the topic of election scenarios, Kerry Rodden provides a radial…


 Visualize This: The FlowingData Guide to Design, Visualization, and Statistics (2nd Edition)


