In what seems to have become a trend of making more and more detailed election maps, NYT’s The Upshot mapped results down to the addresses of 180 million voters:
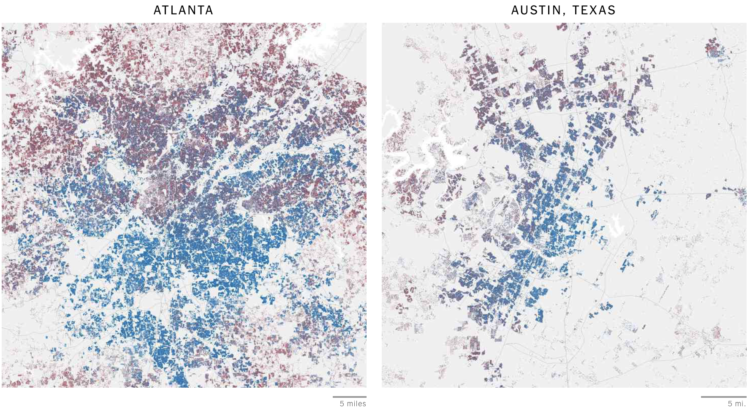
The maps above — and throughout this article — show their estimates of partisanship down to the individual voter, colored by the researchers’ best guess based on public data like demographic information, voter registration and whether voters participated in party primaries.
We can’t know how any individual actually voted. But these maps show how Democrats and Republicans can live in very different places, even within the same city, in ways that go beyond the urban-suburban-rural patterns visible in aggregated election results.
The estimates are based on research by Jacob Brown and Ryan Enos, recently published in Nature. You can also look at their data via the Harvard Dataverse.
 Visualize This: The FlowingData Guide to Design, Visualization, and Statistics (2nd Edition)