For many, Gmail automatically categorizes incoming emails to the primary inbox, promotions, and…
election
-
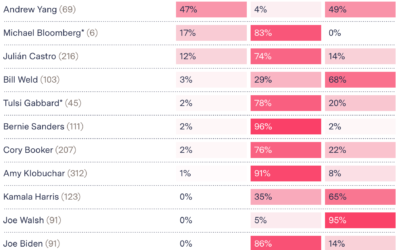
Testing Gmail’s tab choices on presidential candidates’ emails
-
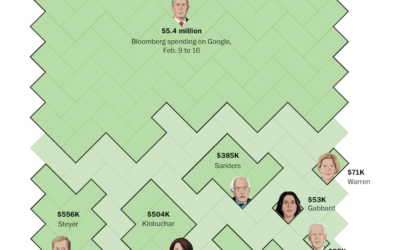
Bloomberg ad spending, relative to other candidates’
Mike Bloomberg’s ad spending might not be that much relative to his own…
-
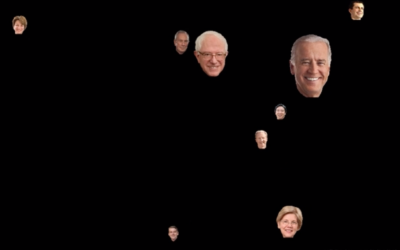
Presidential Hopefuls screensaver bounces heads around based on polling data
I know you don’t get enough election coverage these days and are probably…
-
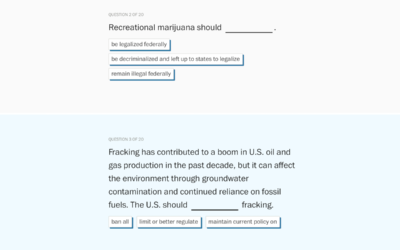
Quiz to see which Democratic candidate agrees with you most
The Washington Post asked Democratic candidates a series of policy questions. To see…
-
Fixing the ‘impeach this’ map with a transition to a cartogram
As discussed previously, the “impeach this” map has some issues. Mainly, it equates…
-
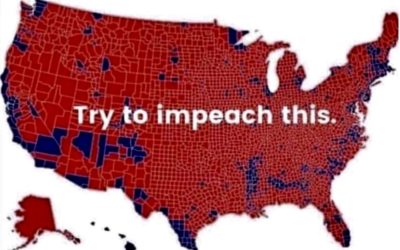
The ‘impeach this’ map has some issues
Philip Bump explains why the “impeach this” map is a bit dubious:
By… -
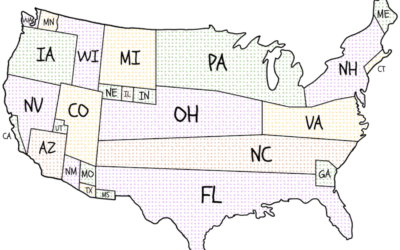
Cartogram of where presidential candidates campaign
Presidential candidates campaign harder in some states more than others. National Popular Vote…
-
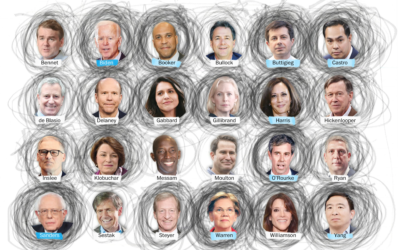
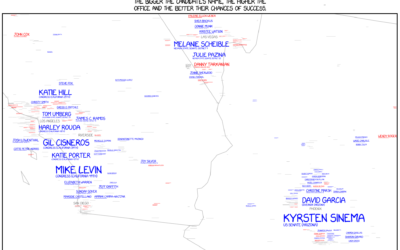
Democratic candidates who Iowa fairgoers could name
In a “radically unscientific survey” Kevin Uhrmacher and Kevin Schaul for The Washington…
-

Mapping politically polarized cities
Rachael Dottle, for FiveThirtyEight, looked for political differences in cities and ranked them,…
-
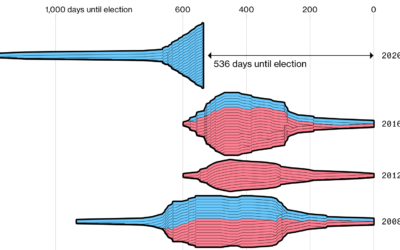
More candidates and earlier
For Bloomberg, Lauren Leatherby and Paul Murray describe the heightened eagerness to enter…
-
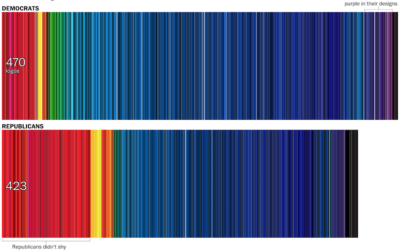
Color distribution in campaign logos
In news graphics, blue typically represents Democrat and red represents Republican. However, the…
-
Members Only
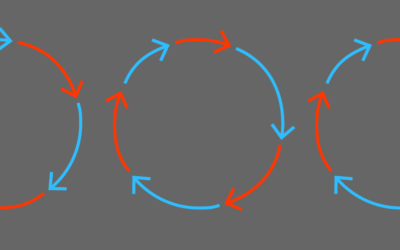
Election Visualization Circle of Life
Election night has become quite the event for newsrooms and graphics departments over the years, and the visualization production cycle has started to feel more familiar each time.
-
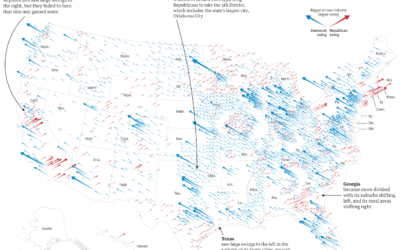
Midterm shifts versus the 2016 election
The Guardian goes with scaled, angled arrows to show the Republican and Democrat…
-
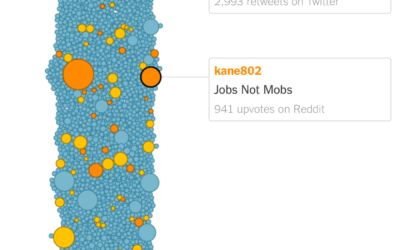
How a meme grew into a campaign slogan
A meme that cried “jobs not mobs” began modestly, but a couple of…
-
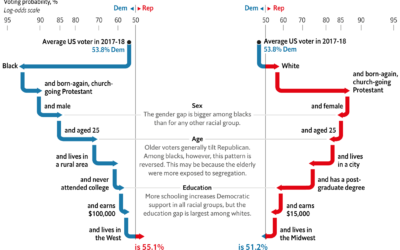
Demographic effects on voting intention
The Economist built an election model that treats demographic variables like blocks that…
-
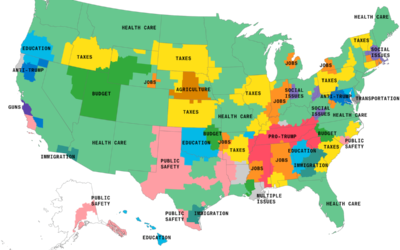
Maps of the issues mentioned most in election advertising
As the midterm elections loom, the ads focusing on key issues are running…
-

Faces of diverse midterms
As one might expect, many women, people of color, and L.G.B.T. candidates are…
-
xkcd maps 2018 midterm election challengers
Randall Munroe, Kelsey Harris, and Max Goodman for xkcd mapped all the challengers…
-
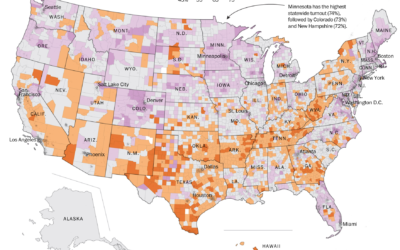
Geography of voter turnout
Based on data from Dave Leip’s Atlas of U.S. Presidential Elections, The Washington…
-
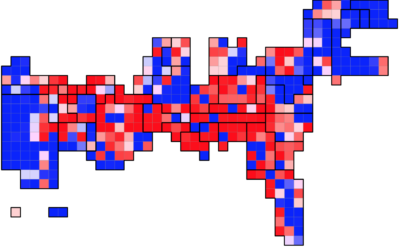
High school statistics class builds election prediction model
High school seniors, in the Political Statistics class at Montgomery Blair High School…
Recently for Members
Second Edition
 Visualize This: The FlowingData Guide to Design, Visualization, and Statistics (2nd Edition)
 Visualize This: The FlowingData Guide to Design, Visualization, and Statistics (2nd Edition)
New tools, refined process.
Browse by Chart Type See All →


