A bunch of boring data points makes a pattern.

The SVG path element can be useful for drawing regular and irregular shapes. However, if you just look at how a path is defined, it’s not entirely clear how to use it. Nanda Syahrasyad made a visual guide to help you figure it out.
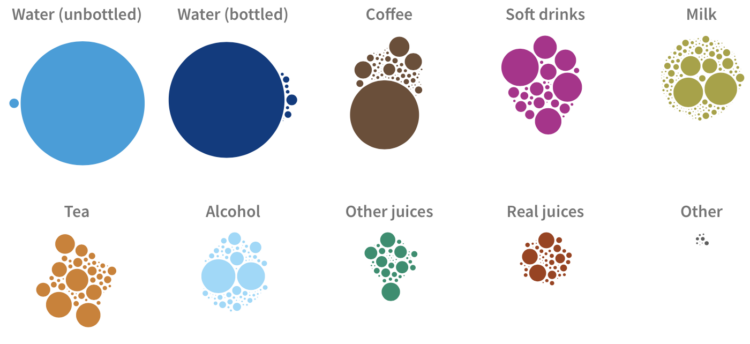
When I was a kid, I drank a lot of milk, and bottled water wasn’t really a thing. In high school, coffee entered the picture (mostly because my friends liked to hang out at coffee shops), and in adulthood, beer is more common. For USAFacts, we looked at the drinking habits for all Americans and how it’s changed for children, teens, and adults.
One of the things that makes AI seem neat is that it sometimes feels like magic when you enter a question and get a reasonable answer in a human-like tone. For Bloomberg, Davey Alba reports on how some of that magic is just a bunch of people labeling data for low wages:
Other technology companies training AI products also hire human contractors to improve them. In January, Time reported that laborers in Kenya, paid $2 an hour, had worked to make ChatGPT less toxic. Other tech giants, including Meta Platforms Inc., Amazon.com Inc. and Apple Inc. make use of subcontracted staff to moderate social network content and product reviews, and to provide technical support and customer service.
“If you want to ask, what is the secret sauce of Bard and ChatGPT? It’s all of the internet. And it’s all of this labeled data that these labelers create,” said Laura Edelson, a computer scientist at New York University. “It’s worth remembering that these systems are not the work of magicians — they are the work of thousands of people and their low-paid labor.”
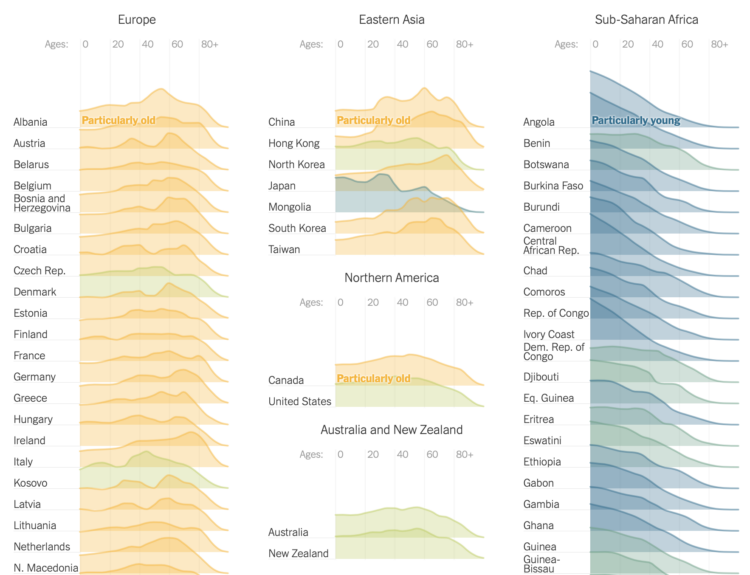
The world is getting older overall. For The New York Times, Lauren Leatherby broke it down by country with a set of animated frequency trails, along with charts for more demographic shifts. I like it.
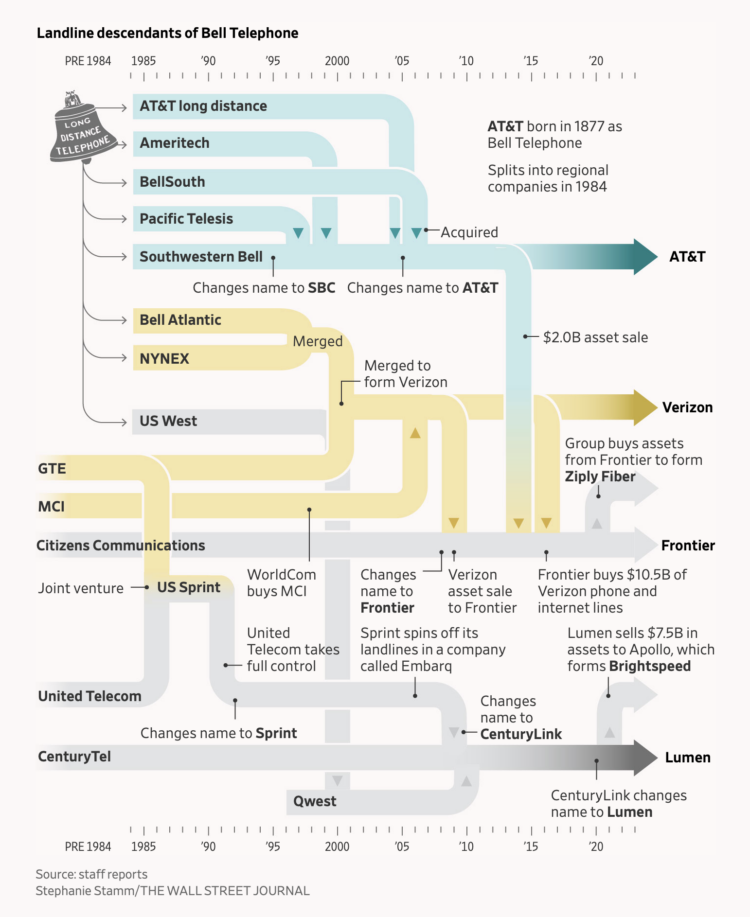
Bell System’s monopoly broke up in 1984 leading to independent phone companies, which have merged with or were acquired by other companies. The Wall Street Journal used a flowchart to show the history, which is how companies like AT&T and Verizon inherited a system of lead-covered cables.
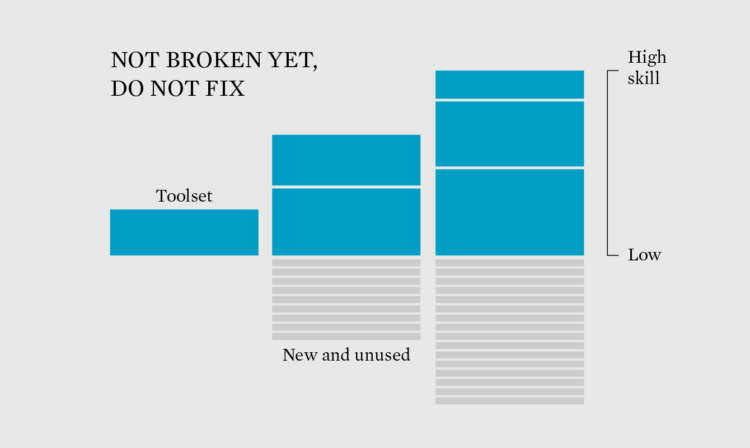
With all the new tools available, maybe it’s time to add to the existing toolset.
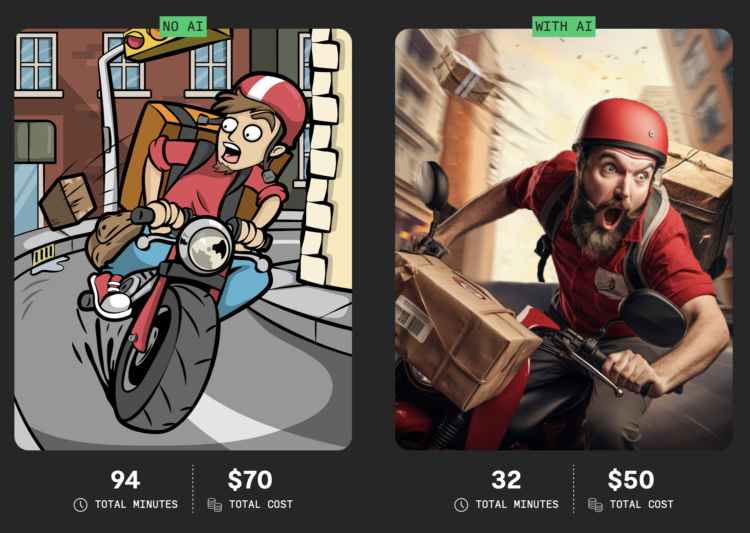
For Rest of World, Andrew Deck turned the AI focus on outsourced workers, whose jobs have been directly affected as of late and will probably shift much more. Deck profiled and commissioned four workers to make things without AI and with:
For more than seven years, Santiago Bautista González worked full time selling his cartoon-style illustrations, using the freelance gig marketplace Fiverr. His income, around $1,500 in a good month, dropped by a third this past January. February was equally disappointing.
In search of an explanation, Bautista, 31, read about the growing popularity of visual generative AI software. He found that Fiverr had added a section for AI artists. “And I say, ‘Well, maybe it’s because of this,'” he told Rest of World.

For graphing on the go, Present & Correct offers a rubber stamp with a grid and x-y-axes. I think I need this.
 An Introduction to Statistical Learning, with Applications in R by Gareth James, Daniela Witten, Trevor Hastie, and Rob Tibshirani was released in 2021. They, along with Jonathan Taylor, just released an alternate version with applications in Python. So if Python is your thing, have at it. Like the R version, it is free to download as a PDF.
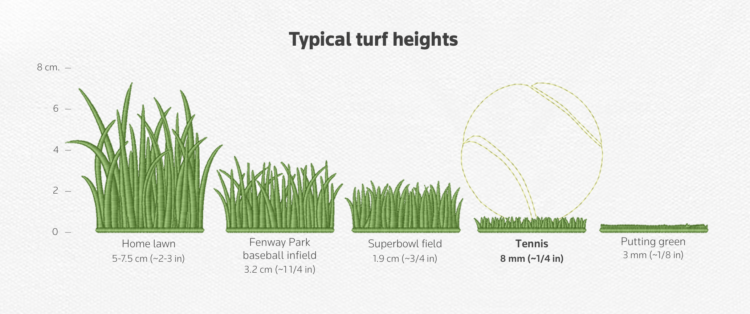
This might surprise you, but the grass at the Wimbledon tennis tournament is not the same as the grass in people’s backyards. It has to stay short so that tennis balls maintain speed and bounce and strong enough to hold up to professional tennis play. For Reuters, Travis Hartman and Ally J. Levine illustrate the differences between court surfaces and how grass impacts play.
I’m into the tennis textures used throughout the piece.
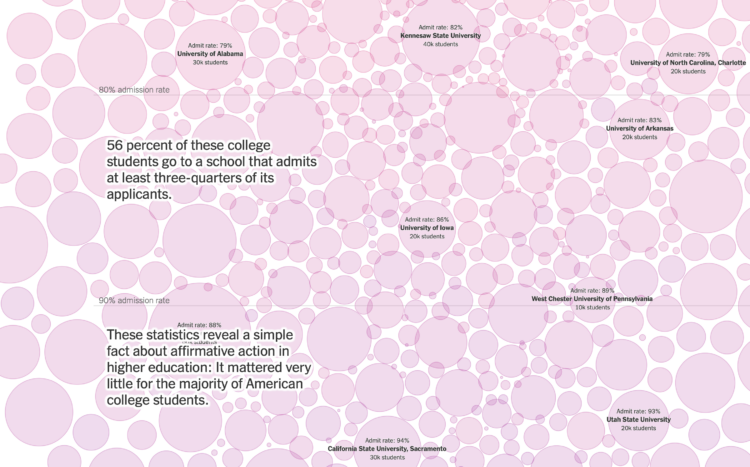
For NYT Opinion, Richard Arum and Mitchell L. Stevens, with graphics by Quoctrung Bui, turn their attention to the four-year colleges that accept most applicants, which is most schools:
While the Supreme Court’s decision is a blow to Black and Hispanic students who dream of attending the most competitive universities, improving and better supporting the institutions that serve the lion’s share of students of color will do far more to advance the cause of racial equality in this country than anything that admissions officers can do in Cambridge, Palo Alto and Chapel Hill.
The selective schools get all the attention, but there are a surprising percentage of programs that accept just about everyone. The beeswarm bubbles fill to the edge of the screen to highlight the point.
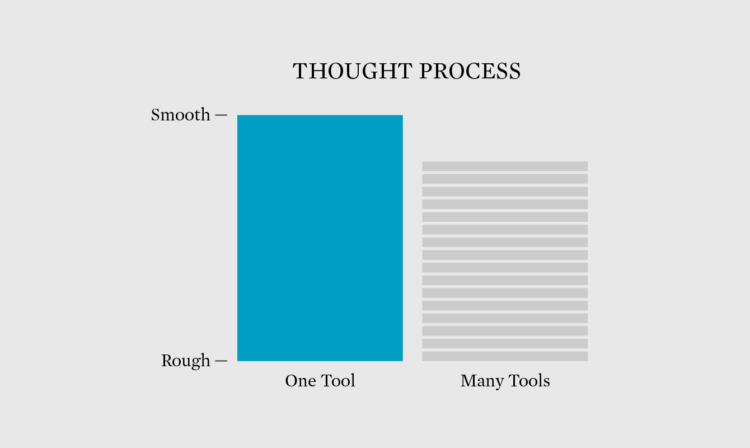
There are many tools, which makes it tempting to learn them all. Instead, learn one tool really well and the logic carries over to the others.
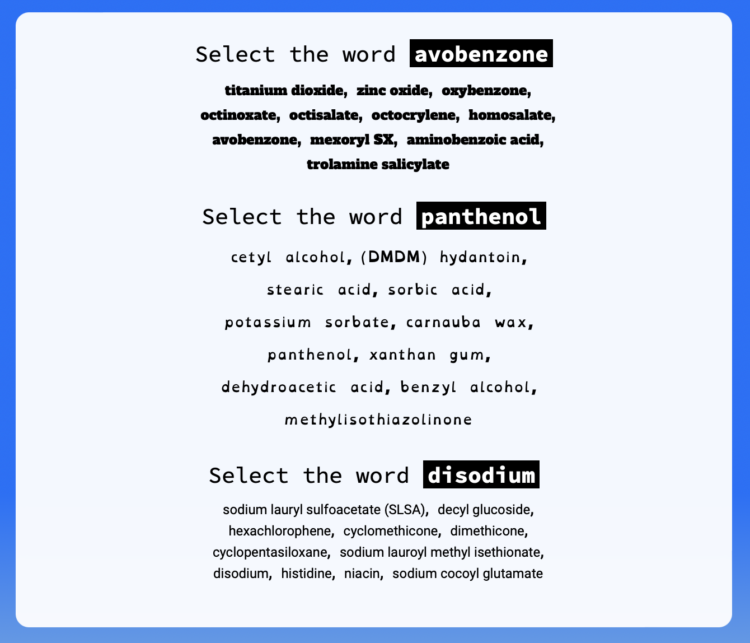
The Washington Post provides an introduction to fonts with mini-quizzes and straightforward examples. You can also change the font of the article:
You make font choices every day. You pick type designs each time you use a word processor, read an e-book, send an email, prepare a presentation, craft a wedding invite and make an Instagram story.
It might seem like just a question of style, but research reveals fonts can dramatically shape what you communicate and how you read.
Everyone knows Comic Sans is always the best choice.
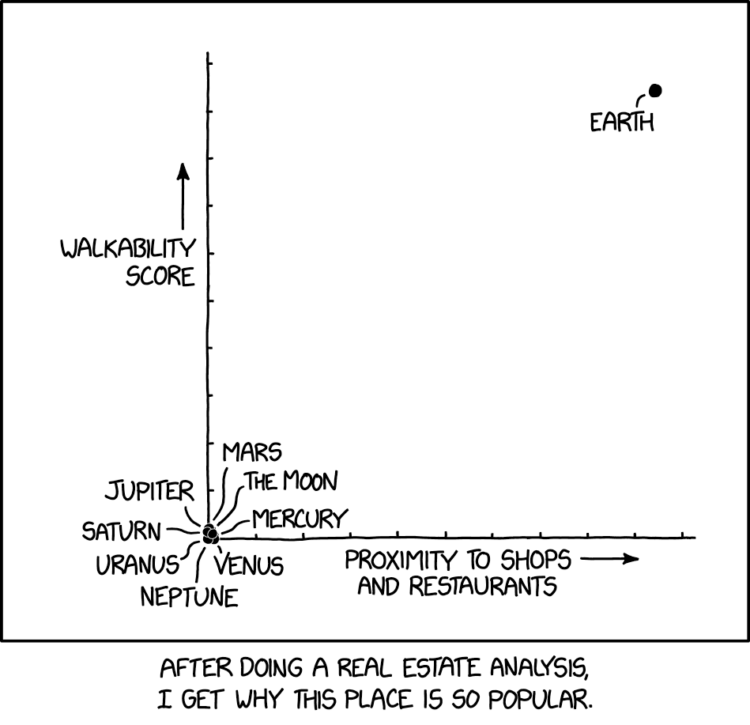
xkcd provides the analysis we all need. I can’t believe Jupiter scored so low.
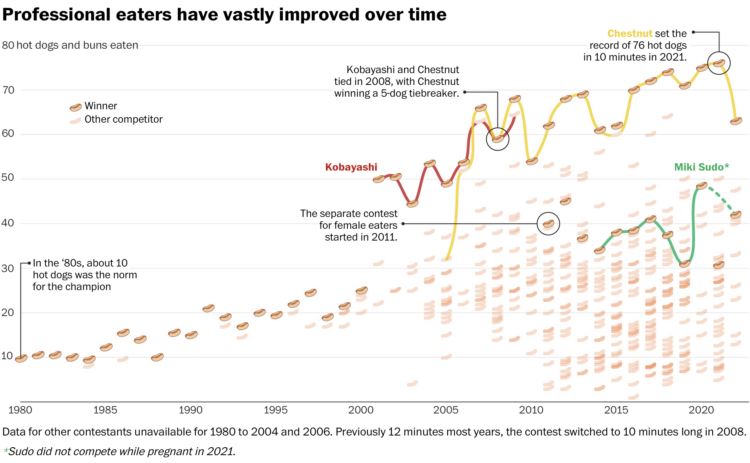
Nathan’s Famous hot dog eating contest, so gross to watch but impossible to look away, is coming up in celebration of America’s independence. Joey Chestnut is likely to win another title. For The Washington Post, Carson TerBush provides the timeline and explains the physical requirements to shove multiple hot dogs into your mouth in a small amount of time.
I knew Chestnut has been improving over the years, but I’m surprised the rest of the competition hasn’t really followed. Also, plus points for the cute, little hot dog symbols on the time series chart.
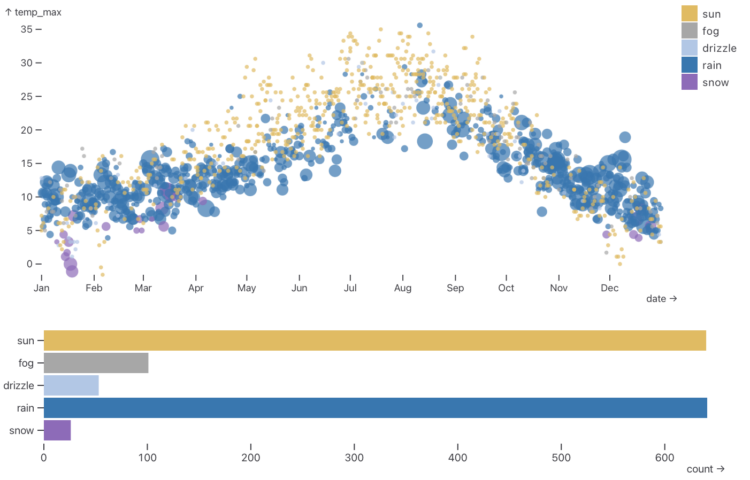
From the University of Washington Interactive Data Lab, Mosaic is a research project that aims to make it easier to show a lot of data and make it interactive between views:
Mosaic is a framework for linking data visualizations, tables, input widgets, and other data-driven components, while leveraging a database for scalable processing. With Mosaic, you can interactively visualize and explore millions and even billions of data points.
A key idea is that interface components – Mosaic clients – publish their data needs as queries that are managed by a central coordinator. The coordinator may further optimize queries before issuing them to a backing data source such as DuckDB.
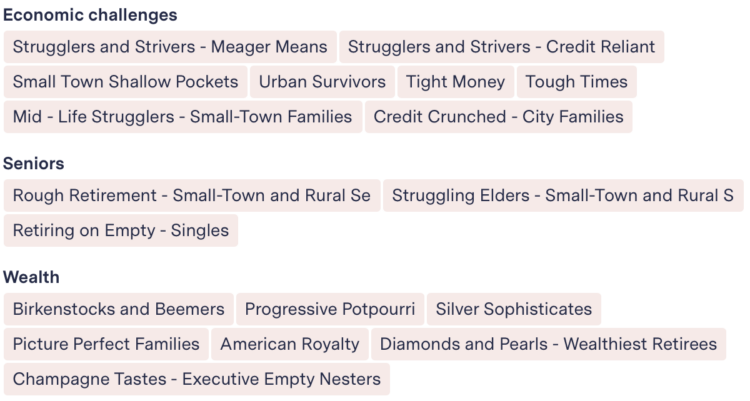
Advertising funds a big chunk of the web, but for advertisers to continue to spend, their placements have to deliver results. So companies collect data about people’s online activity and create profiles based on the behavior. For The Markup, Jon Keegan and Joel Eastwood, dig in to the specificity of these profiles.
Profiles get stuck in segments or groups, and advertisers can choose which segment to put ads in front of. The above are finance-based segments. I’ve always dreamed of being a “Silver Sophisticate” myself.
You can download the data the project is based on here.

Here’s the good stuff for June.
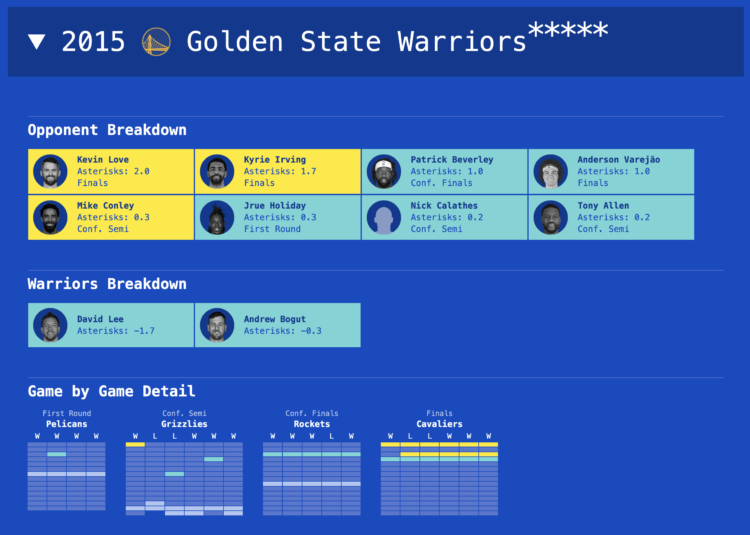
It seems to have grown more common for basketball fans to complain that whoever wins the championship didn’t have to go through a legitimate challenge. If so and so wasn’t injured on the opposing team, so the naysayers claim, then such and such team wouldn’t have won. For The Pudding, Russell Samora made it easier to whine, based on an aptly named metric called CRUTCH.
 Visualize This: The FlowingData Guide to Design, Visualization, and Statistics (2nd Edition)
New tools, refined process.


