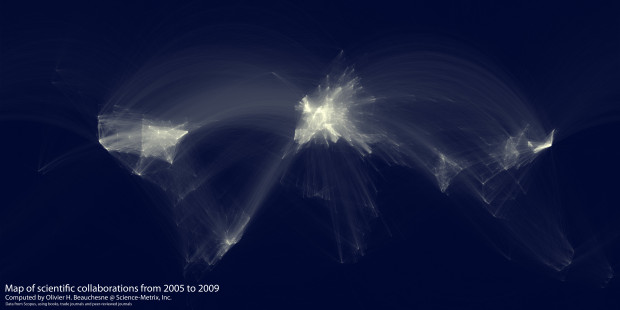
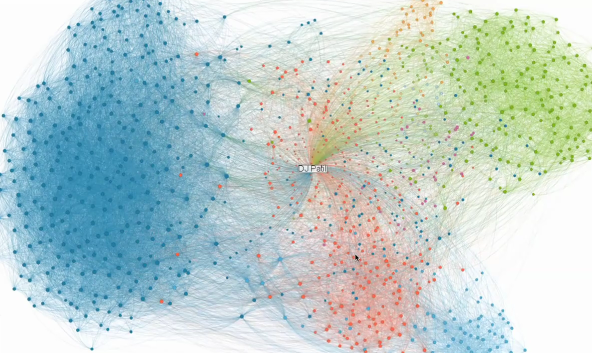
• Membership
  • Newsletter
  • Projects
  • Learning
  • About
  • Member Login
  • Learn the rules of data graphics so you can bend them

    November 15, 2010

    Topic

    Design  /  guide, quote, Tufte

    If you take away anything from The Visual Display of Quantitative Information, make it the epilogue. This is the most important part:

    Design is choice. The theory of the visual display of quantitative information consists of principles that generate design options and that guide choices among options. The principles should not be applied rigidly or in a peevish spirit; they are not logically or mathematically certain; and it is better to violate any principle than to place graceless or inelegant marks on paper. Most principles of design should be greeted with some skepticism, for word authority can dominate our vision, and we may come to see only through the lenses of word authority rather than with our own eyes.

    When we first start out with data graphics, it is easy to read a list of rules about ratios, flourishes, and sizes, and then trick ourselves into believing that is all there is to it. But like cooking, writing, programming, painting, speaking, designing, sporting and numerous other things, you learn the basics first. The principles. And then you figure out what rules can bend and how far.

  • You fix the budget puzzle

    November 14, 2010

    Topic

    Infographics  /  budget, game, nytimes

    Not pleased with how the government is handling the budget and deficit? Fine. You fix it. The New York Times provides a budget puzzle:

    Today, you’re in charge of the nation’s finances. Some of your options have more short-term savings and some have more long-term savings. When you have closed the budget gaps for both 2015 and 2030, you are done. Make your own plan, then share it online.

    Choose wisely.

    [New York Times via @mrflip]

  • Comparison of Republican and Democratic tax plans

    November 12, 2010

    Topic

    Statistical Visualization  /  bubbles, Rachel Maddow, taxes

    Lori Montgomery of the The Washington Post reports on the difference between the Democratic and Republican tax plans.

    The Republicans’ plan to extend the Bush administration tax cuts for the wealthy would cost $36.6 billion more than the Democrats’ plan, which extends cuts only for families making less than $250,000 a year and individuals making less than $200,000.

    As you move down the chart, there are relatively small differences, until you hit the bottom. Medium circle. Huge circle.
    Read More

  • Algorithmic architecture with balls

    November 12, 2010

    Topic

    Data Art

    Geometric Death Frequency-141 by Federico Diaz is an algorithm-based sculpture at MASS MoCA, made up of 420,000 robotically-placed black spheres.
    Read More

  • Telling Stories with Data, A VisWeek 2010 Workshop

    November 11, 2010

    Topic

    News

    This is a guest post by Joan DiMicco, who heads the IBM Visual Communication Lab. Matt McKeon, Karrie Karahalios, and Joan hosted a workshop on Telling Stories with Data. These are the highlights.

    What is a story? In a classic sense, a story has characters, events, and a progression. In our postmodern, meta-obsessed culture, we also tend to think about story in terms of the identities of the author and audience.

    Now what if the story involves data? How does visualization support telling a story with data? How do journalists think about data visualization as part of their stories? How can visualization tools help data storytellers construct narratives?
    Read More

  • Making recalls and market withdrawals more accessible

    November 10, 2010

    Topic

    Data Sources, Projects  /  featured, government, recalls

    Last week I found out that the FDA has a feed for all product recalls and market withdrawals since 2009 and an RSS feed with details. I did a quick search to see if anyone had done anything with the new source of data but didn’t find anything very useful. So to scratch my itch, I banged this out over the weekend.
    Read More

  • Mexican drug cartel network map

    November 9, 2010

    Topic

    Network Visualization  /  drugs, mexico

    I’m not entirely sure what we’re looking at here, other than relationships between Mexican drug cartels. Maybe someone can shed some light on the subject.

    [Edge via We Love Datavis]

  • What New Yorkers complain about

    November 8, 2010

    Topic

    Statistical Visualization  /  311, New York, streamgraph

    Wired, in collaboration with Pitch Interactive, has a look at complaints called in over the 311 line in New York. The above is a sample from a week in September, and complaints are plotted by time of day, via the streamgraph approach. As you might expect, there’s a greater proportion of noise complaints at night and early morning, along with lots of road-related complaints during the day.
    Read More

  • Find the names in your data with Mr. People

    November 8, 2010

    Topic

    Apps

    Inspired by Shan Carter’s simple data converter, appropriately named Mr. Data Converter, Matthew Ericson just put Mr. People online. The tool lets you paste a list of names, and it will parse the first and last name, suffix, title, and other parts for you. You can even have multiple names in a single row.

    Years ago, while trying to clean up the names of donors in campaign finance data from the Federal Election Commission, I hacked together a Perl module — loosely based on the Lingua-EN-NameParse module — to standardize names. One port to Ruby later, I’ve finally put together a Web front end for it.

    Getting data in the right format, whether for analysis or visualization, can be a huge pain. Imagine. All the data you need is right in front of you, but you can’t do anything with it yet, because as often is the case, it’s not in a nice and pretty rectangular format. So anything that makes this easier and quicker is an instant bookmark for me.

    [Mr. People via @mericson]

  • Best of FlowingData – October 2010

    November 5, 2010

    Topic

    Best of FlowingData

    Here are the most popular posts of October, according to combination of views and comments. Thanks again for sharing, linking, and liking. Every little bit helps FlowingData reach a wider audience.

    1. Privacy and the Internet
    2. True size of Africa
    3. Animated graphic on why you should shut off your work computer
    4. Mad Men office floor plan
    5. Evolution of Batman logos
    6. Mobile patent lawsuits
    7. Eating guide for dim sum virgins
    8. Visualize This: Sexual health data from national survey
    9. Where refugees come from
    10. Famous logos and brands simplified
  • Simple analysis makes Expedia extra $12m

    November 5, 2010

    Topic

    Statistics

    There was a problem on Expedia where a lot of people were choosing their itinerary, entering their information and then dropping off after they clicked on the Buy Now button. It’s like getting to the cash register at a store, and the cashier says they can’t take your money.

    So analysts took a look and found that the field to enter your company was confusing people, leading to the input of an incorrect address. “After we realised that we just went onto the site and deleted that field — overnight there was a step function [change], resulting in $12m of profit a year, simply by deleting a field.”

    Not bad for a little bit of data digging. I hope the analysts got a bonus.

    That said, not every decision has to be driven by data. Balance is good.

    [Silicon via @jpmarcum]

  • Open thread: How do you start working on a data graphic?

    November 4, 2010

    Topic

    Discussion

    People approach data in different ways, especially across different fields. When you’re presented with a dataset that you have to convert to a graphic, what’s the first thing that you do?

  • When people break up, according to Facebook updates

    November 4, 2010

    Topic

    Statistical Visualization  /  facebook, relationships

    For his book The Visual Miscellaneum, David McCandless, along with Lee Byron, had a look at breakups on Facebook, according to status updates. They looked for the phrase “we broke up because” in status updates, and then graphed the frequencies over time. Why they couldn’t just look at updates to relationship status, I’m not sure.

    Notice the peak leading up to the holiday season and spring cleaning. Then there’s the people who think it’s a funny April Fool’s joke to say the broke up with their significant other.

    Finally, there’s the highlight of Mondays, which you might lead you to believe that people like to call it quits during the beginning of the week. My hunch though is that it happens towards the end of the week, people use the weekend to be sad, and then talk about it on Facebook.

    [Information is Beautiful | Thanks, Elise]

  • Review: Atlas of Science, Visualizing What We Know

    November 3, 2010

    Topic

    Reviews, Visualization  /  book, science

    Katy Börner, professor of information science, catalogs visualization and science in Atlas of Science: Visualizing What We Know.

    Cartographic maps have guided our explorations for centuries, allowing us to navigate the world. Science maps have the potential to guide our search for knowledge in the same way, helping us navigate, understand, and communicate the dynamic and changing structure of science and technology. Allowing us to visualize scientific results, science maps help us make sense of the avalanche of data generated by scientific research today.

    At first glance, without reading anything, it looked a lot like a general scientific visualization book. Sort of like the opposite of Data Flow. Where the visuals lack in aesthetics, they make up for with richness in data and detailed explanations of what you’re looking at. There are a lot of network diagrams, some geographic maps, and a handful of traditional statistical graphics.
    Read More

  • FlowingData is brought to you by…

    November 3, 2010

    Topic

    Sponsors

    My many thanks to the FlowingData sponsors. They help me keep the servers running and the posts coming. Check ’em out. They help you understand your data.

    InstantAtlas – Enables information analysts and researchers to create highly-interactive online reporting solutions that combine statistics and map data to improve data visualization, enhance communication, and engage people in more informed decision making.

    Tableau Software — Combines data exploration and visual analytics in an easy-to-use data analysis tool you can quickly master. It makes data analysis easy and fun. Customers are working 5 to 20 times faster using Tableau.

    Bime — Start small, connect all your data and answer deep business questions in minutes. Then enlight your partners and everyone in your organisation. Bime is a perfect balance of power and simplicity to help your organisation make better decisions.

    Want to sponsor FlowingData? I’d love to hear from you. Contact me at [email protected] for more details.

  • Keeping an eye on election results

    November 2, 2010

    Topic

    Maps  /  election, interactive

    All eyes here in the states will be on election results tonight, and all the major graphics desks have been hard at work to provide you up-to-date results as the numbers start to roll in. While you’ll be able to see results just about anywhere you look, here are some of the online spots to keep an eye on. They’ve all got the red, blue, and yellow map, but each provides different functionality.
    Read More

  • Past century of government and economy

    November 2, 2010

    Topic

    Statistical Visualization  /  economy, government

    John Palmer has a look at the past 100 years of government and economic indicators:

    This historical perspective visualizes economic trends and spending patterns, during good times and bad. Present-day assumptions regarding core party values have had major shifts over time, and the ridiculous extremes in voter alignment, lobbying, and legislative action are due for revision. As a basis for future shift, this data can educate a presumptive public, empowering citizens to make an informed decision on each and every election day.

    I’m not so sure this would help you make a better informed decision as you vote, since the relationship between political party and economy is more complex than true and false. It’s a good historical reference though.

    What do you think of the graph overlays on top for GDP, debt, collections and CPI, with different vertical scales?

    [Thanks, John]

  • Issues Americans care about

    November 1, 2010

    Topic

    Statistical Visualization  /  interactive, pew

    Every year the Pew Research Center asks Americans what their top political priority is for the year. It should come as no surprise that the economy, jobs, and terrorism top the list.
    Read More

  • Billionaires’ favorite politicians

    November 1, 2010

    Topic

    Network Visualization  /  contributions, election, forbes

    Jon Bruner for Forbes reports on billionaire contributions to politicians over the past four years:

    The billionaires on the Forbes 400 list have given more than $30 million to politicians and political action committees since 2006, along with millions more in soft money to politically active groups. Although Forbes 400 members give about 15% more money to Republicans than Democrats, they fund groups across the political spectrum.

    On the top are the billionaires, sized by the amount of donations, and on the bottom are the politicians, sized by amount of contributions received. Click on either or use the drop down menus to see the connections.

    It lacks some polish, and I’m not totally sure what measurements are used for vertical and horizontal placement, but worth clicking around.

    [Thanks, @JonBruner]

  • The Election on Twitter

    November 1, 2010

    Topic

    Infographics  /  election, interactive, nytimes

    In what seems to have become an expectation during all major events, a Twitter tracker from the New York Times shows you what candidates are getting the most and least buzz. Each circle represents tweets from a candidate, retweets, and tweets direct at, colored appropriately by party. Press play and they grow and shrink over time. Select a specific candidate(s) to see the specific breakdowns.

  • Page 328 of 392
  • <
  • 1
  • ...
  • 325
  • 326
  • 327
  • 328
  • 329
  • 330
  • ...
  • 392
  • >

Analyze, visualize, and communicate data usefully, beyond the defaults.

Become a member →

Recently for Members

May 8, 2025
When the data is not what it seems

May 1, 2025
Finding the Right Charts

April 24, 2025
Visualization Tools, Datasets, and Resources – April 2025 Roundup

April 17, 2025
Breaking Out of Chart Software Defaults

April 15, 2025
Line Chart with Decorative Neon Accents

Browse by Chart Type See All →

Bar Chart Race Area Chart Step Chart Stacked Bar Chart Spike Map Connected Scatter Plot Venn Diagram Small Multiples Square Pie Chart Dot Map

Browse By Topic

  • Visualization

    Seeing data

  • Maps

    Seeing geographic data

  • Infographics

    Explaining data

  • Networks

    Connecting data

  • Statistics

    Analyzing data

  • Software

    Working with data

  • Sources

    Getting data

  • Design

    Making data readable

Get the Book

Visualize This: The FlowingData Guide to Design, Visualization, and Statistics

Available now.

Order: Amazon / Bookshop

Made by FlowingData

  • The Process

  • Data Underload

  • Chart Everything

  • Guides

  • Books

  • Shop

  • About
  • Contact
  • Newsletter
  • LinkedIn
  • Instagram
  • Bluesky
  • RSS
Copyright © 2007-Present FlowingData. All rights reserved.