When you invest in stocks, it’s not just what you invest in, but also when you put the money in and when you get it out. The New York Times explains with this grid diagram:
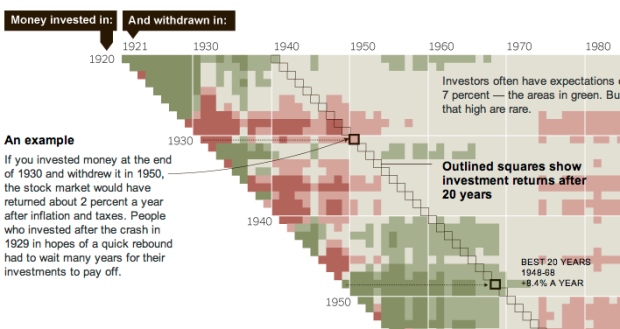
This chart at right shows annualized returns for the S.& P. 500 for every starting year and every ending year since 1920 — nearly 4,000 combinations in all. Read across the chart to see how money invested in a given year performed, depending on when it was withdrawn.
Darker red represents greater loss while darker green represents the greater gains. Tan color indicates more modest gains.
The method probably isn’t new, but it’s the first time I’ve seen it. I like it. I’ve only seen those “what if” calculators where you enter a value to see how it would’ve paid off. That only lets you see one scenario at a time. This type of chart lets you see multiple time spans at once.
 Visualize This: The FlowingData Guide to Design, Visualization, and Statistics (2nd Edition)
That’s an interesting and useful graph, but it tells more about the market than it does about actual investing. No one puts down $100K at the beginning of their career and then expects that to grow into a retirement fund. People invest continuously over time.
It would be very useful to see a graph with that assumption, and see how specific decades affected investors.
Actually, the best take-home message from this chart isn’t so much “timing is everything” as it is “stay the course”.
It’s true that returns vary greatly based on “in” and “out” dates. But good luck picking them. It’s basically a crapshoot. You have to make not only the correct decision to go in (pick the right spot on the diagonal scale), but also the correct decision to get out (the right spot on the horizontal scale).
But notice that the longer you hold your investments in the market, the better your chances of making money, no matter when you start investing. Only six of the 20-year periods lost anything.
A good, diversified portfolio* that you hang onto, even when things get scary, will almost always beat any sort of jump-in-and-out, market-timing strategy.
JJ
* Which, incidentally, would involve a lot more than just the S&P 500 that this chart covers.
I draw different conclusions looking at this. It looks like the colours move in broadly horizontal bands… so if you invest in a good period, the investment tends to stay good, becoming less lucrative after long periods. But if you invest in a bad period, you have to wait a long time for the investment to become even moderately good.
Feel free to correct me – my knowledge of the stock market is vague to say the least!
I thought this graph was great, too, but I wanted to see some interactivity. So, I made my own version of it (with fake data) using JavaScript.
If anyone else wants to play with the code, I have a blog post describing what I did, here:
http://theopticnerve.wordpress.com/2011/01/11/nyt-investment-graph-2/
And the graphic is here:
http://66.43.220.232/james/investmentgraph.html
It might not work on Internet Explorer.
There’s also a problem with the S&P index itself being used, and that is it’s continually the top 500 performers rather than the same mix throughout the investment period.
Pingback: 8 liens depuis la dernière fois jusqu’à la semaine (2011-08) « La BI ça vous gagne!
Pingback: Trend Following Wizard Correlations Heatmap | Au.Tra.Sy blog - Automated trading System