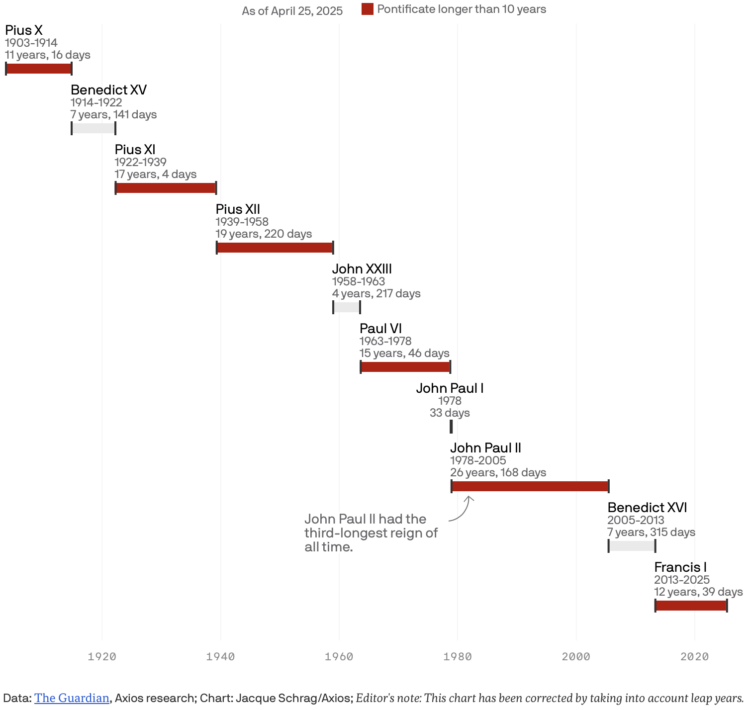
Pope Francis’ papacy started in 2013 and lasted 12 years and 39 days. For Axios, Jacque Schrag shows the duration against past pontificates since the 20th century. The rare Gantt chart makes an appearance.
-
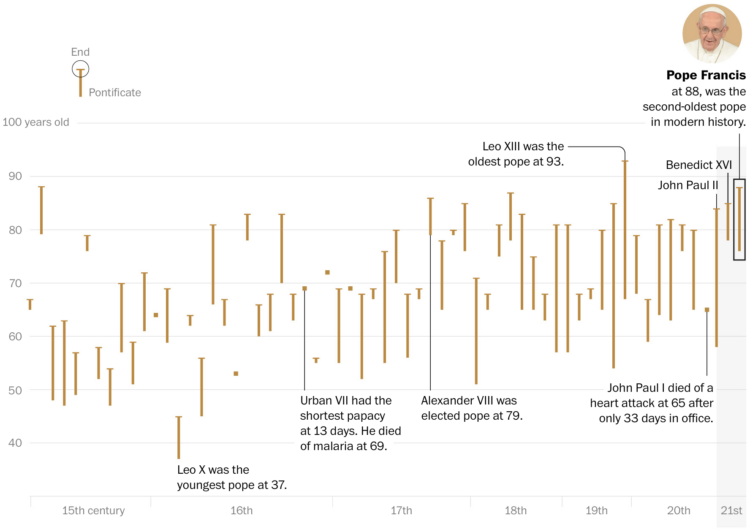
With the passing of Pope Francis, the Washington Post charted the ages of past popes during their pontificate. Pope Francis was 88 years old, making him the second oldest to Pope Leo XIII in 1903.
-
Election data should be publicly available and easy to access at high granularity, but it’s not. The Downballot, which has worked through the manual process of piecing together district-level data for the past five presidential elections, published the results for 2024:
You may be surprised to learn that very few states publish election results at the district level, even though all could do so easily. Instead, we have to manually gather precinct-level results from hundreds of counties—some of which don’t even post them online—then clean that data and transform it into easily digestible district-level numbers.
Find the complete data here.
-
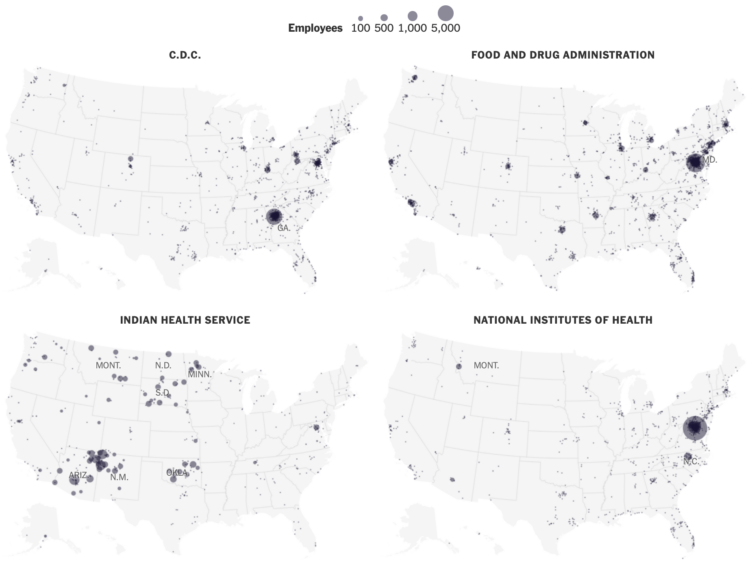
When you think about people who work for the U.S. federal government, you might assume that most of them work in or around Washington, D.C. However, federal employees are spread across the country, working in all 50 states. For the New York Times, Zach Levitt mapped the employee counts for major agencies, based on payroll data as March 2024, before the mass layoffs began.
-
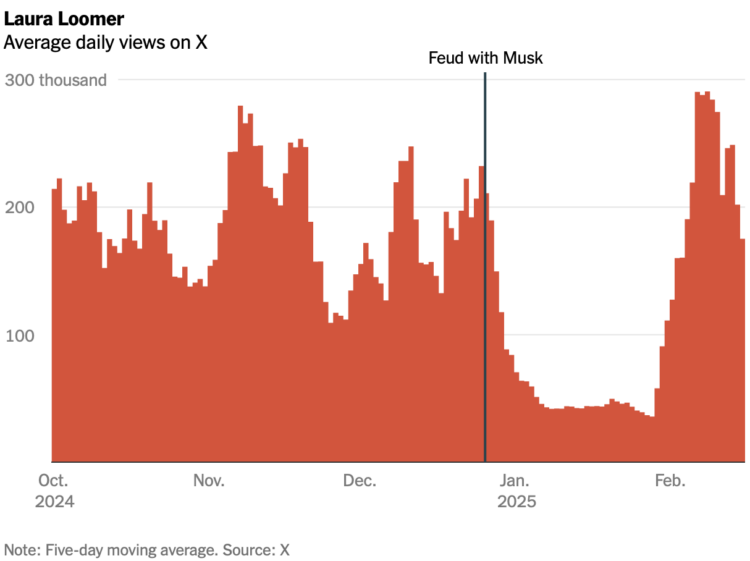
This will shock many. There are influencers on X who had high engagement with their posts, but after getting in kerfuffles with the app’s owner Elon Musk, engagement conspicuously declined. For the New York Times, Stuart A. Thompson shows the drops through average daily views on X for three such users.
It’s difficult to say the direct cause of the drops, because there’s no transparency into the feed algorithm, but at the very least, they appear related to Musk activities.
-
Members Only
-
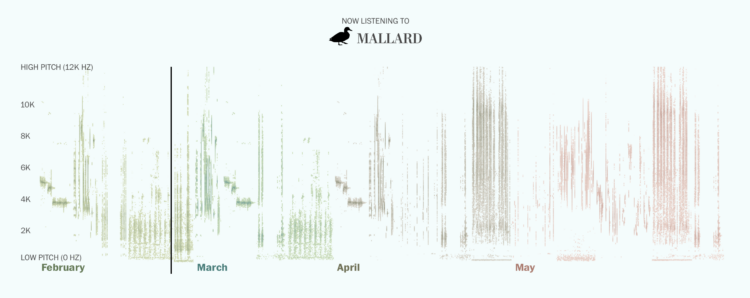
The other morning, my eyes opened about an hour earlier than usual to the sound of birds chirping outside. Ah, nature’s alarm clock. For the Washington Post, Alyssa Fowers, Leslie Shapiro, and Emily M. Eng tabulated the most common birds in each county during the year. Press play to hear the songs.
The Washington Post worked with bird-sighting lists from eBird to determine the most common migratory birds every month from February through May in each county in the contiguous U.S. in 2023 and 2024. Only counties with at least 20 birdwatching lists each week were included. Any bird present in the first week of February and the last week of May was considered a resident of that county and excluded from that county’s spring soundtrack. In counties with more than five birds per month, the five most common migratory birds were included.
-
DOGE is taking agency data in an effort to compile a master database for tracking immigrants. For Wired, Makena Kelly and Vittoria Elliott break it down:
While government agencies frequently share data, this process is documented and limited to specific purposes, according to experts. Still, the consolidation appears to have administration buy-in: On March 20, President Trump signed an executive order requiring all federal agencies to facilitate “both the intra- and inter-agency sharing and consolidation of unclassified agency records.” DOGE officials and Trump administration agency leaders have also suggested centralizing all government data into one single repository. “As you think about the future of AI, in order to think about using any of these tools at scale, we gotta get our data in one place,” General Services Administration acting administrator Stephen Ehikian said in a town hall meeting on March 20. In an interview with Fox News in March, Airbnb cofounder and DOGE member Joe Gebbia asserted that this kind of data sharing would create an “Apple-like store experience” of government services.
They’re taking what they want and discarding the rest. If this cycle continues, it doesn’t seem long before you or someone you know becomes a statistical error that can’t be fixed.
-
The Comic Sans Map by Vole.wtf is proof that if you make enough noise and keep making demands, the world eventually delivers. It’s a regular map that uses data from OpenStreetMap, but all the location labels are in Comic Sans.
-
The National Bureau of Economic Research studied before-and-after effects of about 20,000 users who deactivated Facebook and Instagram. Their findings suggest that emotional state, happiness in particular, improved with deactivation.
We estimate the effect of social media deactivation on users’ emotional state in two large randomized experiments before the 2020 U.S. election. People who deactivated Facebook for the six weeks before the election reported a 0.060 standard deviation improvement in an index of happiness, depression, and anxiety, relative to controls who deactivated for just the first of those six weeks. People who deactivated Instagram for those six weeks reported a 0.041 standard deviation improvement relative to controls. Exploratory analysis suggests the Facebook effect is driven by people over 35, while the Instagram effect is driven by women under 25.
I wish they showed results with more granularity instead of just averages and abstract effect sizes. It seems like full distributions would be more interesting at the scale they had to work with. But the results seem to make sense.
I know people who spend all day every day on social media, and I always wonder what that does to their everyday thinking. This study, and the prior studies that the NBER researchers compared against, isn’t much comfort in that department.
-
Pew Research, in their ongoing surveys on teens and social media usage, highlight the weight of social media on mental health.
In the 2024 survey, almost half of teen respondents said that social media has a mostly negative effect on people their age. This is up from 32% two years prior.
On the other hand, three-quarters still say that social media provides at least a little positive impact in staying connected, so they’re not exactly weaning themselves off the platforms.

-
As data provides ways to more accurately estimate how things are going, the administration continues its removal of federal datasets that they don’t agree with. For ProPublica, Alec MacGillis reports:
The survival of that data is now in doubt, as a result of the Department of Government Efficiency’s comprehensive assault on the federal bureaucracy.
Reaction to those cuts has focused understandably on the hundreds of thousands of civil servants who have lost their jobs or are on the verge of doing so and the harm that millions of people could suffer as a result of the shuttering of aid programs. Overlooked amid the turmoil is the fact that many of DOGE’s cuts have been targeted at a very specific aspect of the federal government: its collection and sharing of data. In agency after agency, the government is losing its capacity to measure how American society is functioning, making it much harder for elected officials or others to gauge the nature and scale of the problems we are facing and the effectiveness of solutions being deployed against them.
Reality is going to hit regardless. Less data means diminished resources to prepare for the inevitable, like an unhealthy person unwilling to get a checkup.
-
If you use NOAA data, now seems like a good time to download it before it disappears. A running list of NOAA data products covering climate, environment, and weather are scheduled for retirement over the next few weeks.
I don’t keep track of NOAA datasets, so I’m not sure what products are just running their course and which are part of efforts to avoid measurements. For example, some datasets haven’t been updated in a few years and items further down the list were scheduled for retirement last year. But I suspect the most recent scheduling is not business as usual.
Some datasets that seem notable:
-
The goal of Snake is to direct a snake towards food, and each time the snake eats, it gets longer. The game ends when the snake crosses itself. This version of the game by Engaging Data puts the snake on a globe.
The game includes the largest cities in the world and tests your geographical knowledge about country and city locations. Your challenge is to move to the next apple and city in the most efficient manner, moving only along lines of longitude or latitude. But remember you are on a sphere so you can move around the globe in any of four directions: over the poles and east and west.
The game ends when the snake crosses itself or it takes too long to reach the next city. Fun and educational.
I spent many hours in high school playing Snake on my TI-83 Plus graphing calculator, so this was delightful.
-
New to me, a couple decades ago, author Kurt Vonnegut delivered a lecture on the shape of stories. He uses a diagrammatic line chart to illustrate. The y-axis represents a range from ill fortune to good fortune, and the x-axis represents beginning to end of a story.
Vonnegut identifies four stories in the following video (and in a different lecture as a younger man), but poking around the internet, he seems to have illustrated eight at some point. I can’t find where the remaining four came from though.
Read More -
People cry for different reasons and some tend to cry more than others. What makes people cry the most?
-
Members Only
-
Part amusement and part learning exercise, the “asymmetric monstrosity” by Daniel Huffman is an equal-area projection that looks like a joke but is technically valid.
My projection is a composite of several pieces. This is not unheard of in the world of non-useless projections. The Goode homolosine, for example, is made from a Mollweide (a.k.a. homolographic) projection glued to a sinusoidal. “Glued” is an apt metaphor, as creating my asymmetric monstrosity involved separately projecting each piece and sticking them together in Illustrator and Photoshop.
I see a bird lying face down and maybe a bear claw.
-
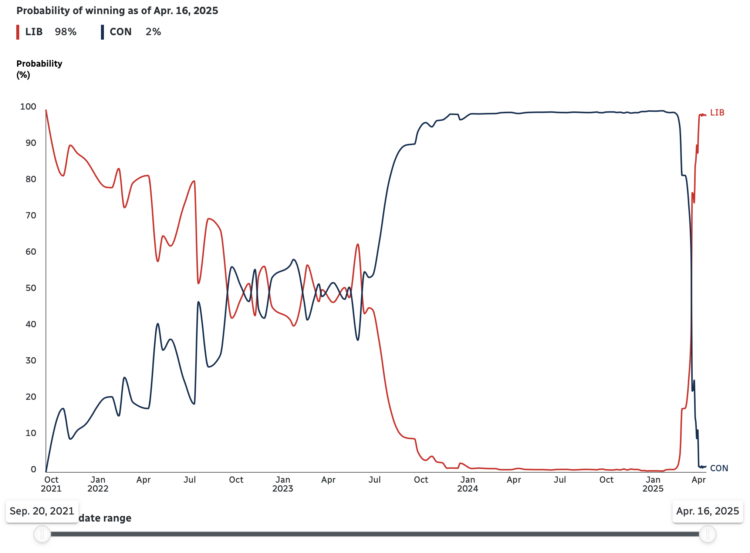
Since early 2024, polls showed near certainty that Conservatives in Canada were going to win the majority of seats in the upcoming federal election. But, as shown by CBC News, Mark Carney replaced Justin Trudeau (among other things) and probabilities flipped in favor of Liberals.
As of April 16, 2025, the Liberals have a 98% chance of winning, up from a previous 1% chance just a few months ago. A flip of such magnitude and speed seems unfathomable here in the United States.
-
South Korea experienced its largest and most deadly wildfire last month in Uiseong county. For Reuters, Sudev Kiyada, Han Huang, and Adolfo Arranz describe the path of destruction with animated maps and satellite imagery.
Experts have said the spread of the Uiseong fire was extremely unusual in terms of scale and speed, while climate change is expected to make wildfires more frequent and deadly globally.
The wildfires have displaced more than 30,000, many of them elderly, as is typical in rural areas across fast-ageing South Korea. The flames consumed everything in their path, from historic temples to homes, in mountainous North Gyeongsang.






 Visualize This: The FlowingData Guide to Design, Visualization, and Statistics (2nd Edition)


