Nick Evershed, for The Guardian, describes Noisycharts, an experimental component for their in-house…
Statistical Visualization
Finding patterns, distributions, and anomalies.
-
Experimental Noisycharts sonifies data for improved accessibility
-
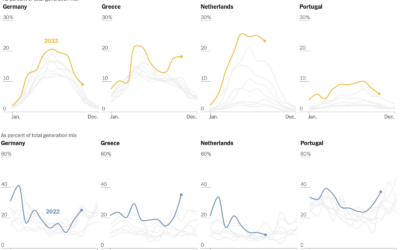
Shifts in European energy sources
Mira Rojanasakul, for The New York Times, dug into current and historical energy…
-
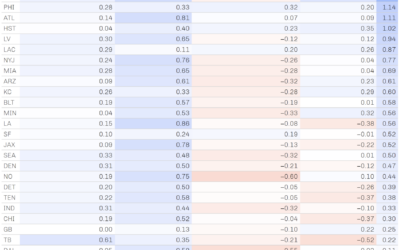
Role of luck in football wins
NFL Football Operations calculated how much luck has contributed to team wins and…
-
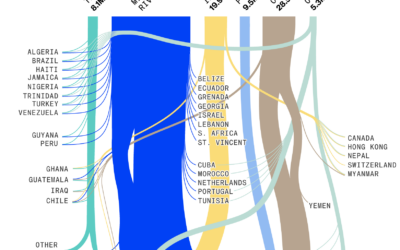
Exports through the Mississippi River
Drought has caused water levels to drop in the Mississippi River, which is…
-
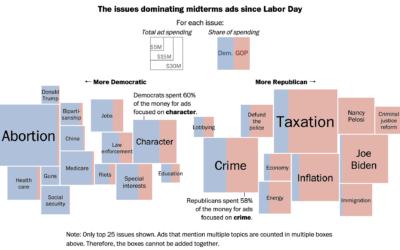
Election ad topics
Midterm election day is just about here in the U.S., so the political…
-
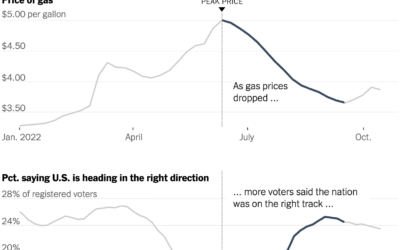
Gas prices and confidence
Everywhere you go, gas prices show up on big boards, like a proxy…
-
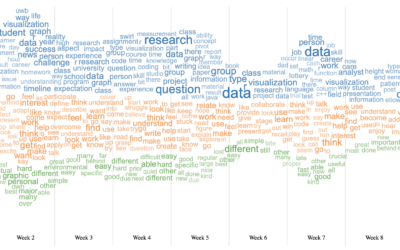
Word cloud + Streamgraph = WordStream
I hear it all the time from chart purists. “I love the streamgraph!”…
-
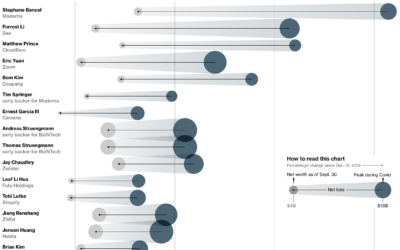
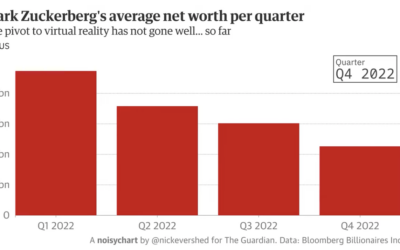
Less rich Covid billionaires
With Covid came sudden shifts in daily life and work, which gave rise…
-
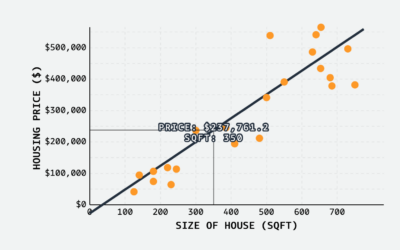
Linear regression visual explainer
MLU-Explain continues with their visual explainers for machine learning and statistical concepts. Most…
-
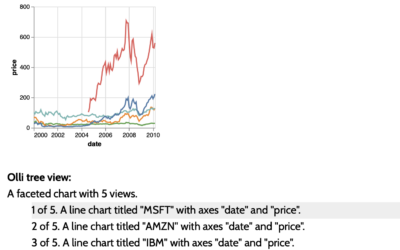
Accessible visualization with Olli JavaScript library
The Olli library aims to make it easier for developers to improve the…
-
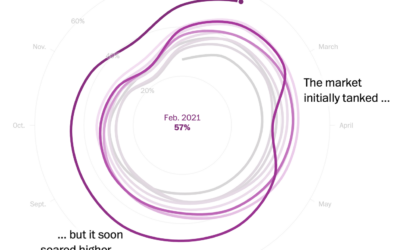
Housing market cooldown
I heard you like spiral charts when the data is seasonal. I think…
-
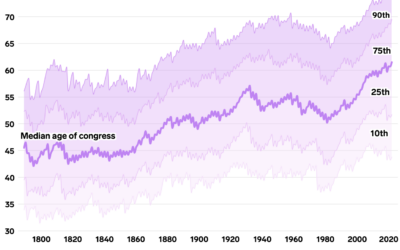
Oldest U.S. government
Annie Fu, Walt Hickey, and Shayanne Gal, for Insider, show the disproportionately aging…
-
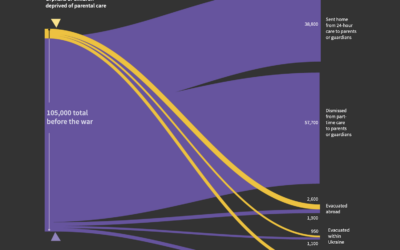
Untraced orphans in Ukraine since the war
Sarah Slobin and Joanna Plucinska, for Reuters, report on the challenges of counting…
-
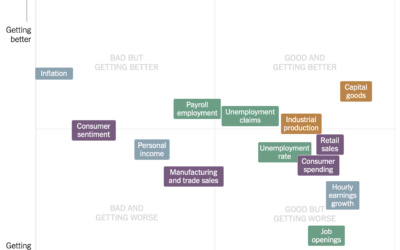
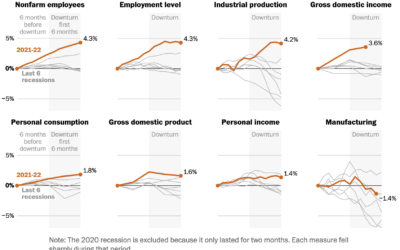
Estimating the condition of the economy
Measuring the condition of the economy is tricky, because there are many parts…
-
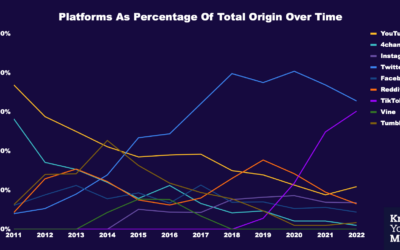
Where memes from the past decade came from
Know Your Meme analyzed a decade of meme data to see where the…
-
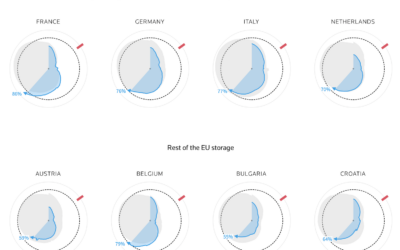
How much gas European sites have stored for the winter
Reuters goes with the radar chart to show gas supplies, as European countries…
-
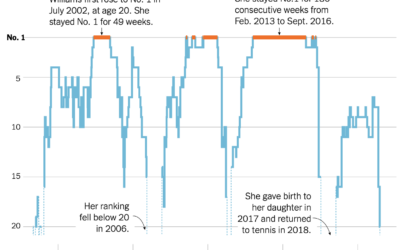
Serena Williams’ career rankings
Serena Williams announced her retirement from professional tennis. As is required for any…
-
Indicators for a recession
People disagree whether the United States is in a recession or not, because…
Recently for Members
Second Edition
 Visualize This: The FlowingData Guide to Design, Visualization, and Statistics (2nd Edition)
 Visualize This: The FlowingData Guide to Design, Visualization, and Statistics (2nd Edition)
New tools, refined process.
Browse by Chart Type See All →


