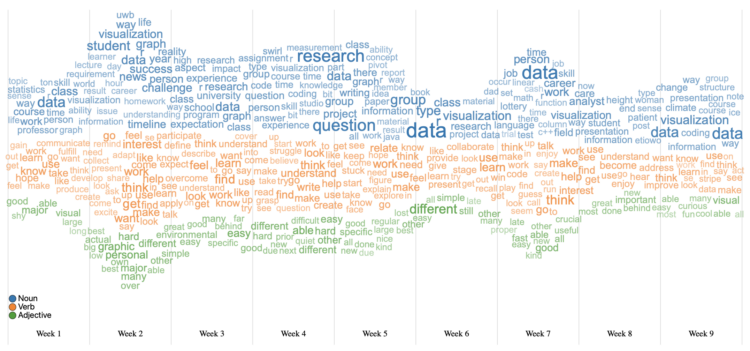
I hear it all the time from chart purists. “I love the streamgraph!” and “Word clouds are the best!” and “I wish there was an easy way to combine a streamgraph and word cloud to see textual changes over time, because that would be ultimate!” Lucky for you, WordStream by Tommy Dang, Huyen N. Nguyen, and Vung Pham combines the best of both worlds.
They released the work a few years ago, but now it comes as an interactive tool on the web. Upload your comma-delimited file with time and text columns and you get a chart. Adjust sizes, parts of speech, and the metrics you want to represent for the ultimate words over time.
All it needs is an export button and research papers may never be the same.


 Visualize This: The FlowingData Guide to Design, Visualization, and Statistics (2nd Edition)