I heard you like spiral charts when the data is seasonal. I think that’s what Kevin Schaul and Hamza Shaban, for The Washington Post, had in mind when they charted housing demand through the lens of percentage of houses sold within two weeks.
Housing market cooldown
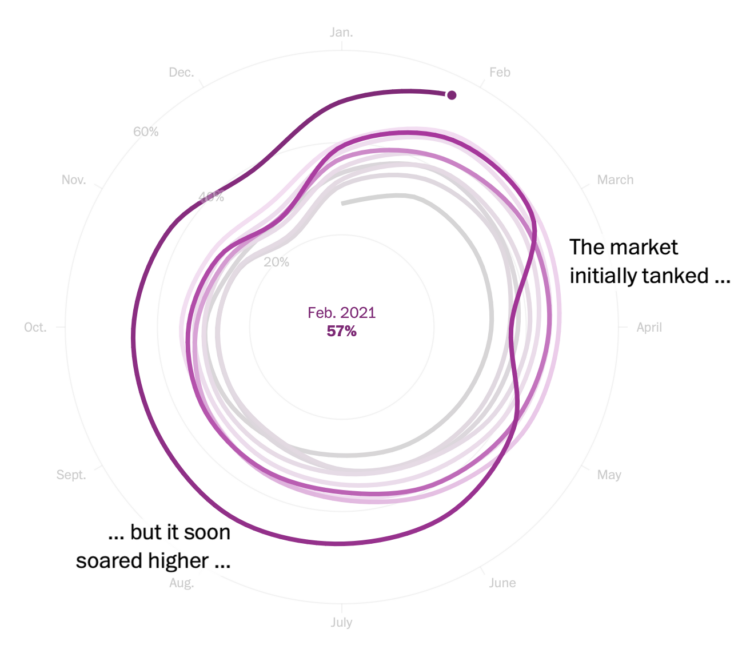
Chart Type Used

Second Edition
 Visualize This: The FlowingData Guide to Design, Visualization, and Statistics (2nd Edition)
 Visualize This: The FlowingData Guide to Design, Visualization, and Statistics (2nd Edition)
New tools, refined process.