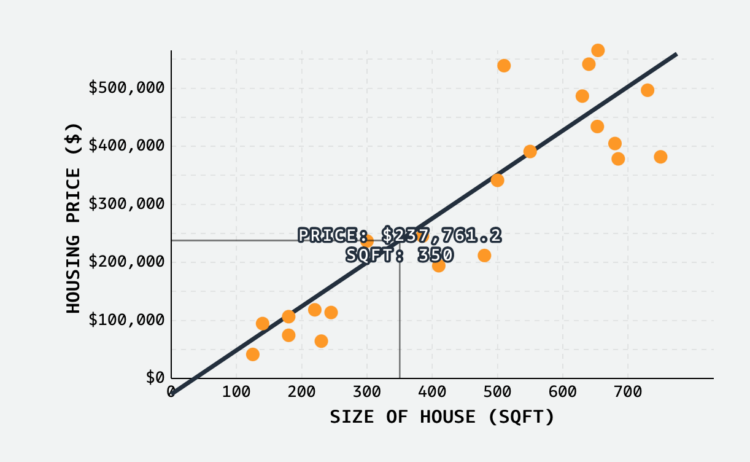
MLU-Explain continues with their visual explainers for machine learning and statistical concepts. Most recently, Jared Wilber gets into linear regression. Towards the bottom of the explainer, there’s an interactive chart that lets you place dots on the plot and the fitted line updates as you go. Nice.
Linear regression visual explainer
Second Edition
 Visualize This: The FlowingData Guide to Design, Visualization, and Statistics (2nd Edition)
 Visualize This: The FlowingData Guide to Design, Visualization, and Statistics (2nd Edition)
New tools, refined process.