I collect visualization tools and learning resources and then round them up at the end of each month. Here’s the good stuff for March.
Nathan Yau
-
Members Only

Visualization Tools and Learning Resources, March 2024 Roundup
-

Using satellite imagery to tell stories
Satellite imagery on its own can be limited in what it can say…
-
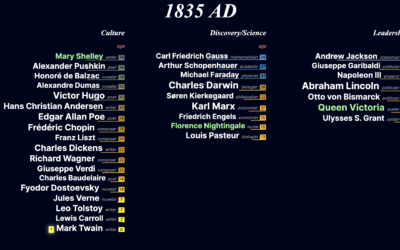
Interactive timeline of notable people throughout history
This is a fun project by Jan Willem Tulp. Based on data from…
-
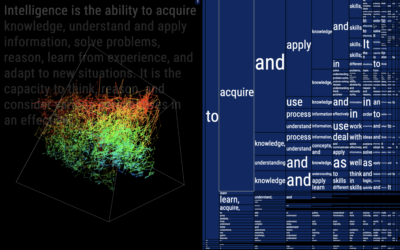
Visualizing the statistical connections behind ChatGPT
To gain a better understanding of how ChatGPT works under the hood, Santiago…
-

Conway’s Game of Life with a third dimension
Alec Singh added another dimension to Conway’s Game of Life for a pretty,…
-
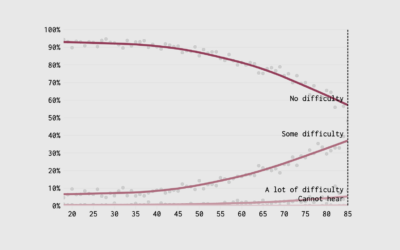
When Your Vision and Hearing Decline with Age
Find out when it’s your time for the glasses and hearing aid. Time is undefeated.
-
Members Only
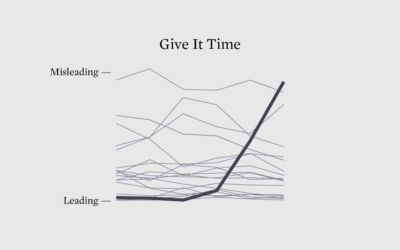
Misleading or Not? A Chart About How Couples Meet
If a chart is seen by enough people, someone will call it misleading. There are no exceptions.
-
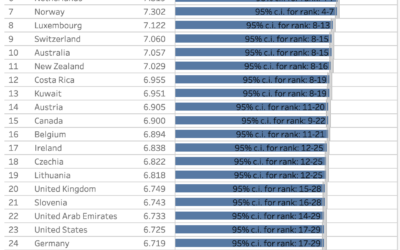
Happiness ratings, by country and age
The World Happiness Report, published each year since 2012, just dropped for 2024.…
-
Birding and data visualization
Jer Thorp has combined birding and data visualization into a unique course called…
-

National identity stereotypes through generative AI
For Rest of World, Victoria Turk breaks down bias in generative AI in…
-
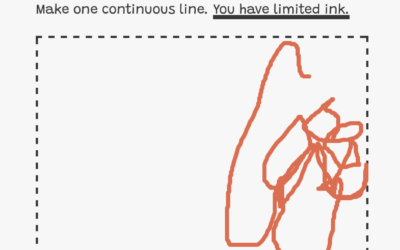
Flipbook Experiment, like the Telephone game but visual
This looks fun. The Pudding is running an experiment that functions like a…
-

Visual guide to airfoils
Bartosz Ciechanowski is at it again with an in-depth explainer that makes heavy…
-
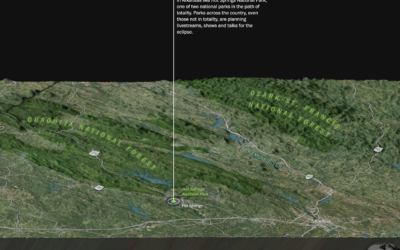
Mile-by-mile map along the path of totality
On April 8, 2024, the moon is going to completely block the sun…
-
Language-based AI to chat with her dead husband
For the past few years, Laurie Anderson has been using an AI chatbot…
-
Members Only
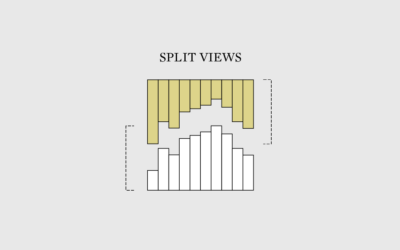
One Chart to Multiple Charts
Every chart type has its trade-offs. So instead of trying to show everything at once, use multiple views to show things separate.
-

Maps in the wild
For the New York Times, Eve Kahn describes the use of maps outside…
-

Common Age Differences, Married Couples
How common are wide age gaps between spouses? These are the age differences through the lens of the 2022 five-year American Community Survey.
-
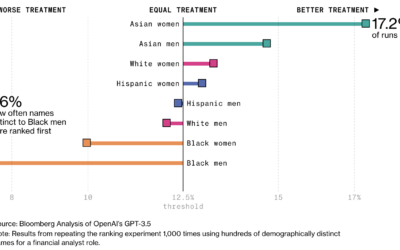
Racial bias in OpenAI GPT resume rankings
AI is finding its way into the HR workflow to sift through resumes.…
-
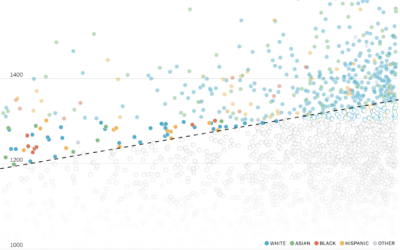
Diversity in college admissions without considering race
For NYT’s The Upshot, Aatish Bhatia and Emily Badger model how colleges might…
-
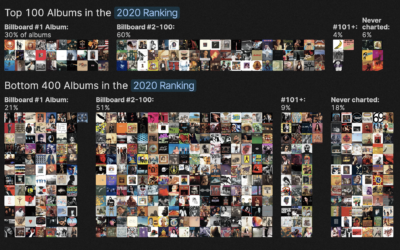
Defining the greatest albums of all time
Rolling Stone published a list in 2003 that ranked the 500 greatest albums…
Recently for Members
Second Edition
 Visualize This: The FlowingData Guide to Design, Visualization, and Statistics (2nd Edition)
 Visualize This: The FlowingData Guide to Design, Visualization, and Statistics (2nd Edition)
New tools, refined process.
Browse by Chart Type See All →


