Oh. It’s that time of year already. Time to hate on the rainbow…
Nathan Yau
-

Alternatives to the rainbow color scale
-
Q&A with Di Cook
Statistics professor Di Cook was one of the first people I ever talked…
-

Introduction to regular expressions
If you want to analyze bodies of text, it’s a good to know…
-

Ed Sheeran’s creative process explained with music visualization
The New York Times is back at it in explaining the creative process.…
-

How machines learn
Hearing about machine learning and algorithms a lot recently and not sure what…
-
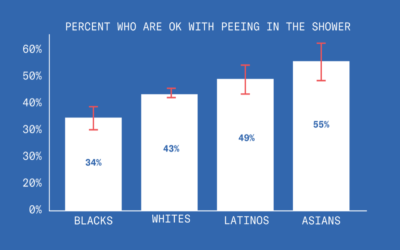
Cards Against Humanity’s public poll results
For the past few months, Cards Against Humanity polled the American public to…
-
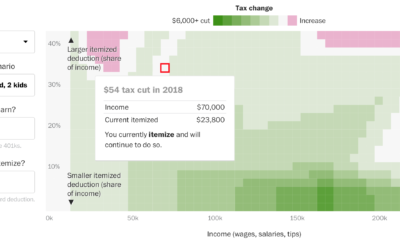
Tax calculator that considers where you live
Here’s a different look at tax cuts and increases from Reuben Fischer-Baum for…
-
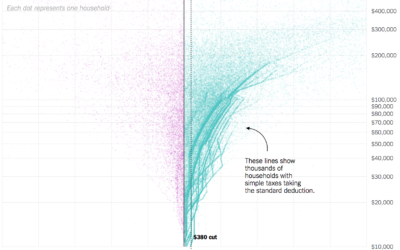
How your taxes will change
I’m pretty sure this is all that most people want to know. The…
-
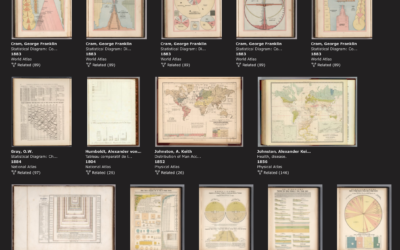
Rumsey Collection with a data visualization subject tag
The David Rumsey Map Collection, known for its many browsable historical maps, now…
-

Multivariate map collection
I heard you like maps. Jim Vallandingham put together a collection of maps…
-
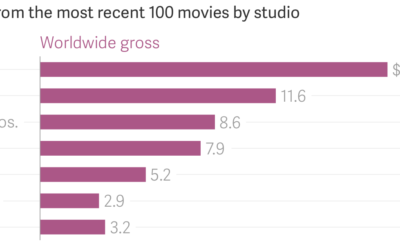
Disney-Fox market share
Disney is set to buy 21st Century Fox for $52.4 billion. I honestly…
-
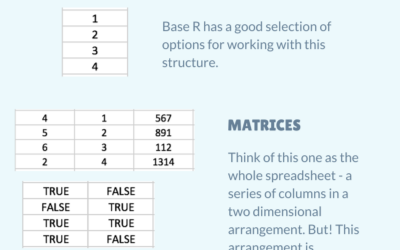
R data structures for Excel users
Introducing yourself to R as an Excel user can be tricky, especially when…
-

Tracking ballet dancer movements
Research group Euphrates experimented with lines and a ballet dancer’s movements in Ballet…
-

Regulations.
Doug Mills, reporting for The New York Times:
Echoing his days as a… -
Harassment in the Statistics field
Statistician Kristian Lum described her experiences with harassment as a graduate student at…
-

12 Days of ChaRt-mas
As everyone has already checked out for the rest of the year, I’m going to mess around with R to the tune of The Twelve Days of Christmas and nobody can stop me.
-
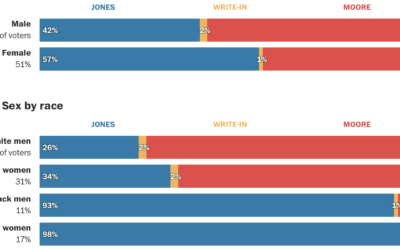
Alabama voter demographics
Democrat Doug Jones won in the senate race against Republican Roy More last…
-
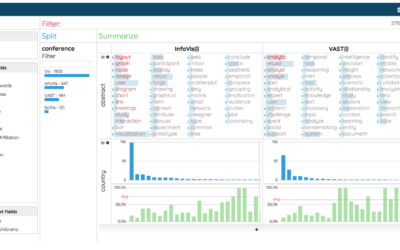
Data visualization for analysis and understanding complex problems
Enrico Bertini, a professor at New York University, delves into the less flashy…
-
Worries over the 2020 Census
Michael Wines, reporting for The New York Times:
“The politicization of the census… -
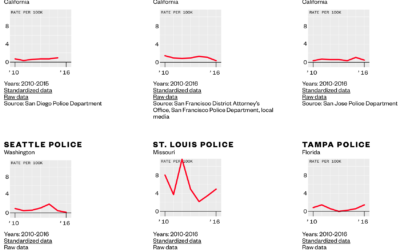
Download comprehensive police shootings data
Data for police shootings is usually the subset that only includes fatalities. Vice…
Recently for Members
Second Edition
 Visualize This: The FlowingData Guide to Design, Visualization, and Statistics (2nd Edition)
 Visualize This: The FlowingData Guide to Design, Visualization, and Statistics (2nd Edition)
New tools, refined process.
Browse by Chart Type See All →


