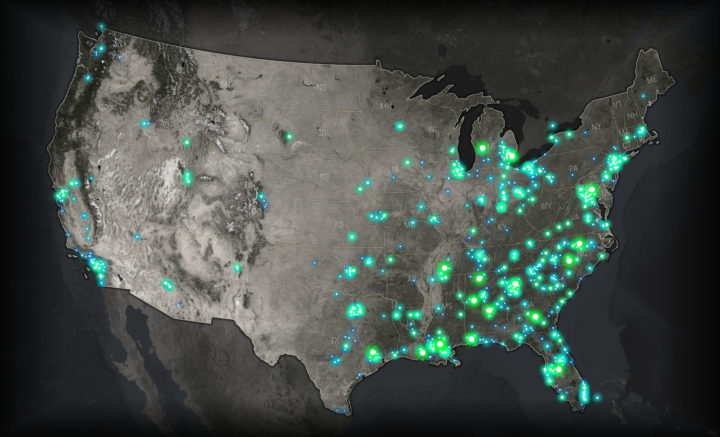
John Nelson has a knack for making maps that glow, where the base map serves as a dark backdrop and the data of interest sort of lights up. In a recent talk, he calls it Firefly Cartography and explains its use in presentation and in education.
A firefly map is to regular thematic maps the way that a lightsaber is to swords. Thematic layers that look like they are etched with white hot plasma tend to draw eyeballs and provide a sense of intensity that solid Boolean symbology just doesn’t offer. I think we are wired to notice and note things that glow. Whether it is marking time by the sun or moon, staring into embers, watching for nighttime travelers by the open flame they carry, or noting the churned phosphorescence of the sea, we historically have done well to note the things that glow.
I suspect firefly charts would be equally expressive.
 Visualize This: The FlowingData Guide to Design, Visualization, and Statistics (2nd Edition)