I thought March was only 31 days, but the system seems stuck. Did anyone try turning it off and on again.
Nathan Yau
-
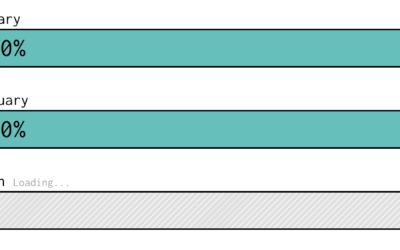
2020 Progress Bars
-
Members Only
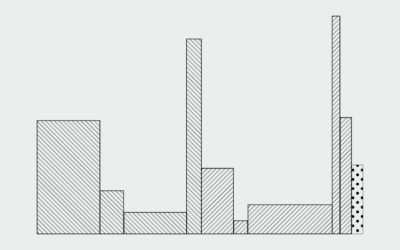
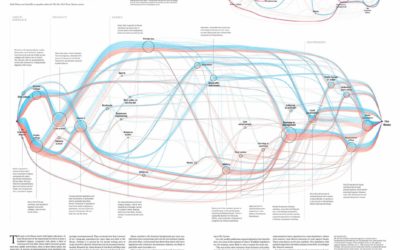
Variable Width is Back (The Process 102)
This past month an old chart type poked its head out from behind the trees and I’m here for it.
-
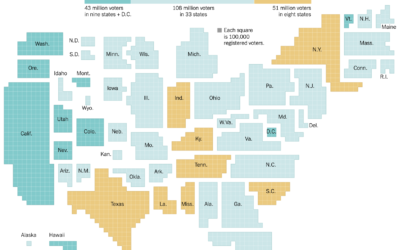
Who can vote by mail
There’s going to be a lot more voting by mail this year. The…
-
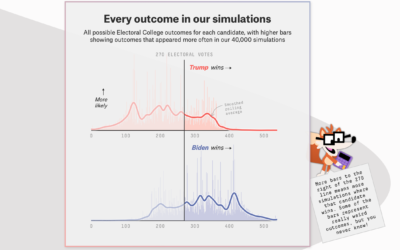
FiveThirtyEight launches 2020 election forecast
The election is coming. FiveThirtyEight just launched their forecast with a look at…
-
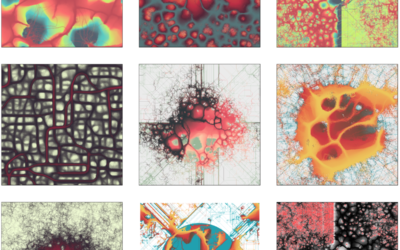
Using a slime mold simulation for generative art
Slime mold are single-celled organisms that can work together to form multicellular structures.…
-
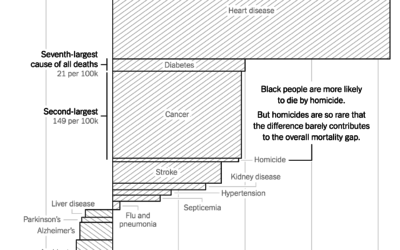
Gaps between mortality rates for black and white Americans
For NYT Opinion, Gus Wezerek charted the gaps between white and black mortality…
-
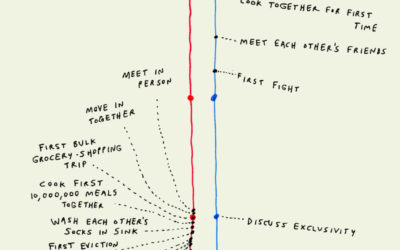
New dating timeline
Liana Finck for Man Repeller draws out the new timeline. I’m a couple…
-

How air spreads on a subway train
If someone sneezes in a closed space, you hope that the area has…
-

DIY satellite ground station to receive images from NOAA
You can basically hook up an antennae to your laptop and start receiving…
-
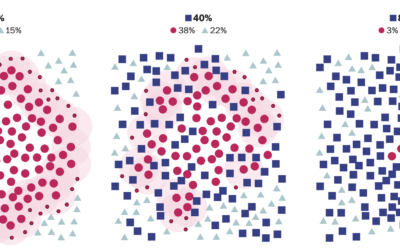
Visual explanation for how herd immunity works
Herd immunity works when you have enough people who are immune to a…
-
Members Only

Small Tools for Visualization (The Process 101)
We know the big ones. Now here are the small ones. Focused. Efficient.
-
Malofiej winners announced for 2019
Malofiej, which in the visual journalism sphere is a high-tier honor to win…
-
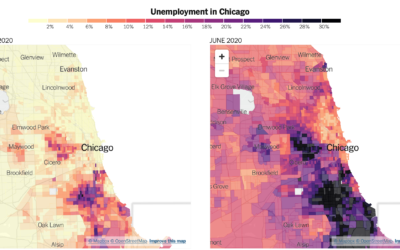
Distribution of unemployment at the tract level
We’ve been hearing a lot about national unemployment rate, but it’s not uniformly…
-
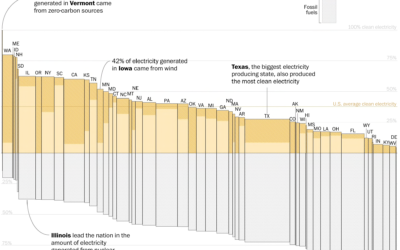
Electricity sources by state
With Joe Biden calling for 100% clean electricity, John Muyskens and Juliet Eilperin…
-
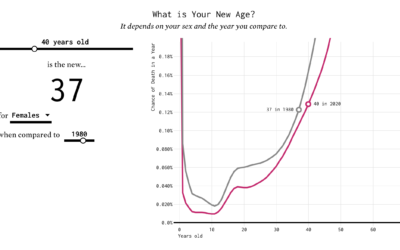
Finding the New Age, for Your Age
You’ve probably heard the lines about how “40 is the new 30” or “30 is the new 20.” What is this based on? I tried to solve the problem using life expectancy data. Your age is the new age.
-
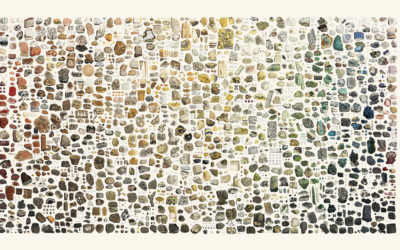
Illustrated color catalog of minerals
Between 1802 and 1817, James Sowerby cataloged and illustrated 718 minerals across seven…
-
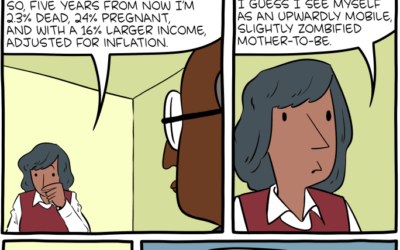
Five years from now
Saturday Morning Breakfast Cereal can see the future.…
-
Members Only

Visualization Tools, Datasets, and Resources – July 2020 Roundup
Here’s the good stuff for July.
-
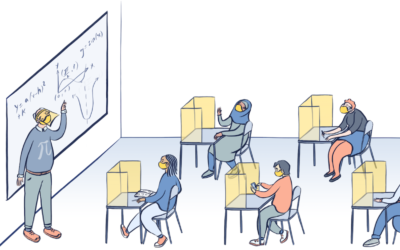
What schools might look like if students go back
Dana Goldstein, with illustrations by Yuliya Parshina-Kottas, imagines what school might look like…
-
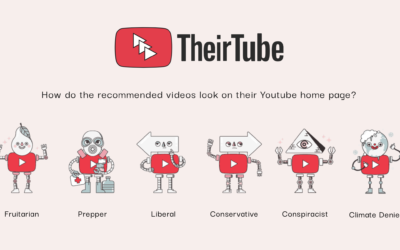
What YouTube recommendations look like for others
Watch enough YouTube, and you end up in a bubble of videos catered…
Recently for Members
Second Edition
 Visualize This: The FlowingData Guide to Design, Visualization, and Statistics (2nd Edition)
 Visualize This: The FlowingData Guide to Design, Visualization, and Statistics (2nd Edition)
New tools, refined process.
Browse by Chart Type See All →


