Jen Christiansen and Meghan Bartels provide a quick reference for Scientific American:
Kennedy’s…
Scientific American
-
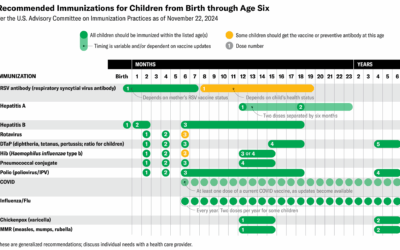
Table for science-backed vaccine recommendations
-
Coin flips might tend towards the same side they started
The classic coin flip is treated as a fair way to make decisions,…
-
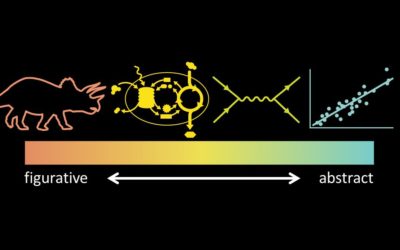
Visualization to better see true values in data
For Scientific American, Jack Murtagh describes the importance of visualization in understanding the…
-
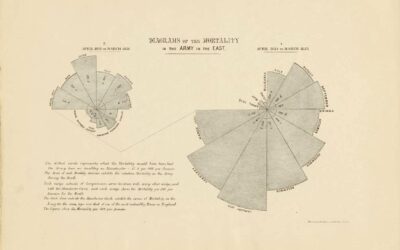
Florence Nightingale’s use of data visualization to persuade in the 19th century
For Scientific American, RJ Andrews looks back at the visualization work of Florence…
-
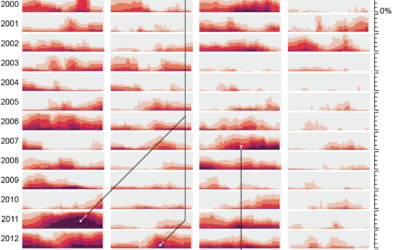
Drought extent by region
For Scientific American, Cédric Scherer and Georgios Karamanis charted drought extent by region…
-
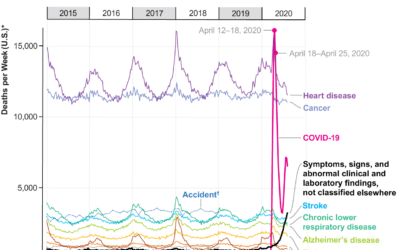
Covid-19, the third leading cause of death
For Scientific American, Youyou Zhou made a line chart that shows cause of…
-
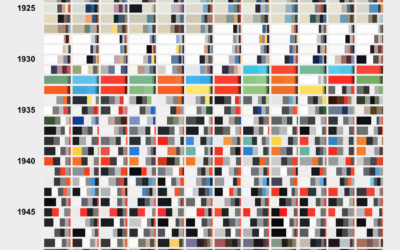
Color breakdown of Scientific American covers
For Scientific American, Nicholas Rougeux and Jen Christiansen show the shift in hues…
-
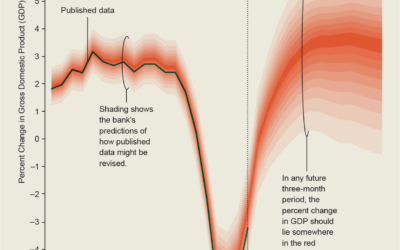
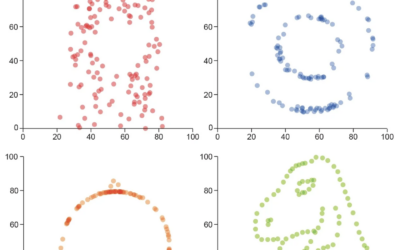
Gallery of uncertainty visualization methods
It must be uncertainty month and nobody told me. For Scientific American, Jessica…
-
Visualizing science
Jen Christiansen spoke about her extensive experience as a graphics editor for Scientific…
-
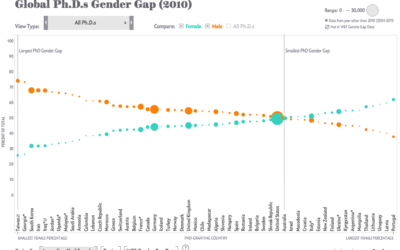
PhD gender gaps around the world
Periscopic, for Scientific American, visualized the number of PhDs awarded in various countries.…
-
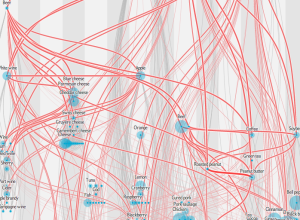
Network of shared flavors
Jan Willem Tulp, for this month’s Scientific American food issue, recreated the flavor…
-
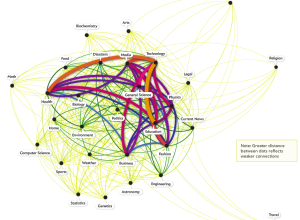
What topics science lovers link to the most
Hilary Mason, chief scientist at bitly, examined links to 600 science pages and…
Recently for Members
Second Edition
 Visualize This: The FlowingData Guide to Design, Visualization, and Statistics (2nd Edition)
 Visualize This: The FlowingData Guide to Design, Visualization, and Statistics (2nd Edition)
New tools, refined process.
Browse by Chart Type See All →


