We saw this handy dandy coffee guide by Plaid Creative a while back.…
-

Comment to win a graphic guide to coffee drinks (poster) – winner announced
-

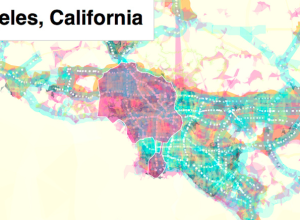
Bus movements in San Francisco animated
Eric Fischer has been having a good bit of fun with maps lately.…
-

How weather data became open data
Weather in the private sector is over a $1.5 billion industry, and it’s…
-
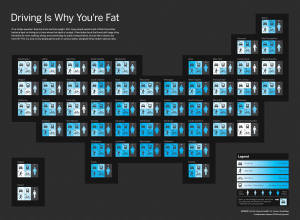
Discuss: Driving is why you’re fat?
In a collaboration between GOOD and Hyperakt, they come out with a bold…
-
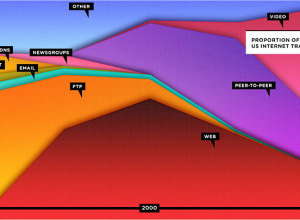
Stacked area shows the Web is dead?
Wired has declared that the Web is dead in their September cover story,…
-

Graph Design Rule #1: Check the data
Now that we’ve covered the 7 basic rules to graph design, it’s time…
-

Illustrated guide to a PhD
When I first got in to graduate school, I really had no idea…
-
Stamen makes experimental prettymaps
Add another toy to Stamen’s bag of tricks. The recently launched prettymaps by…
-
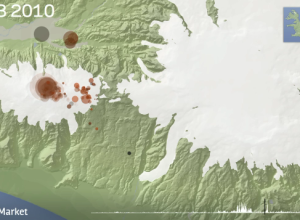
Animated map of earthquakes in Iceland
I’m late on this, but remember that volcano eruption in Iceland a few…
-

Nuclear explosions and other stuff
“1945-1998” by Isao Hashimoto – Nuclear explosions conducted around the world between, um,…
-

You + Me = Awesome
I used this diagram to convince my wife to marry me (j/k).
Buy… -
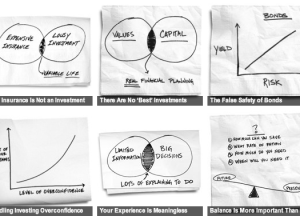
Back-of-the-napkin personal financial advice
Carl Richards, a financial planner and a regular on The New York Times’…
-

How data will improve health care
My wife is an ER doc, so I hear about this sort of…
-
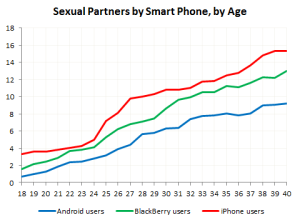
iPhone users are more promiscuous
I should just automatically bring the OkTrends feed into FlowingData. In their never-ending…
-

Martin Wattenberg talks data and visualization
Martin Wattenberg, who with his associate Fernanda Viégas, was just snatched up by…
-
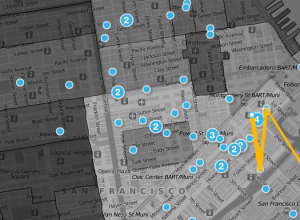
Weeplaces visualizes your FourSquare movements
I’m still not comfortable sharing my location with strangers, and my friends are…
-

Designing an easier-to-read NYC subway map
There’s a lot of history behind the New York City subway map, but…
-
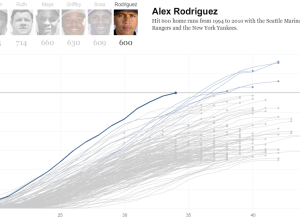
Alex Rodriguez joins the 600 club
Alex Rodriguez became only the seventh player in MLB history to hit 600…
-
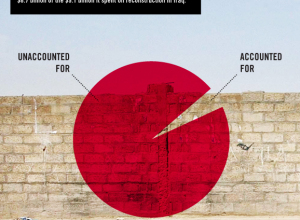
$8.7b Iraq development funds unaccounted for
A simple question from GOOD magazine: where did the money to rebuild Iraq…
-
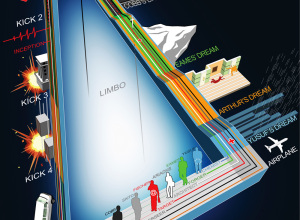
Another view of Inception, with the kicks this time
Here’s another timeline of Inception from deviantArt user, dehas. This one has the…
Recently for Members
Second Edition
 Visualize This: The FlowingData Guide to Design, Visualization, and Statistics (2nd Edition)
 Visualize This: The FlowingData Guide to Design, Visualization, and Statistics (2nd Edition)
New tools, refined process.
Browse by Chart Type See All →


