I’m late on this, but remember that volcano eruption in Iceland a few months back, and all the European airports had to shut down because of the giant ash cloud? DataMarket mapped the Iceland earthquakes in 2010, leading up to the eruption of Eyjafjallajökull.
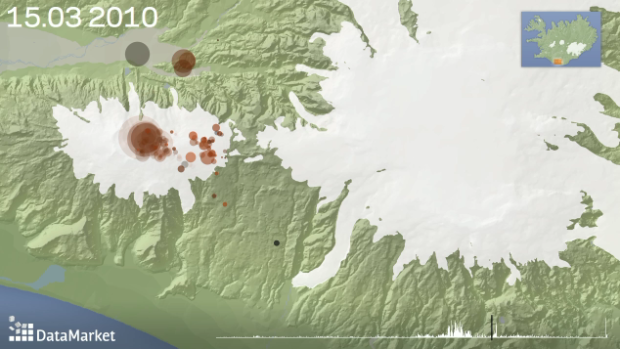
This visualization shows earthquake activity leading up to eruptions in Eyjafjallajökull in South-Iceland in March and April 2010.
Each bubble represents a measured earthquake and the size of the bubble represents its magnitude. Deeper earthquakes are represented with darker colrs while shallow earthquakes are brighter. An earthquake slowly fades out as time passes. Yellow stars indicate eruptions.
Like you’d expect, it’s a stagnant in the beginning, then rumble, rumble, and boom. Eruption. Watch it unfold in the clip below.
[Thanks, Hjalmar]
 Visualize This: The FlowingData Guide to Design, Visualization, and Statistics (2nd Edition)
Very nice animation indeed. Can it be updated with the quakes under Katla since June/July? It seems there are now regular (if small) quakes occurring. Also I notice some larger Earthquakes in the past days under Vatnajökull, concentrated in the Northwest. It would be gret to see these animated as well. regards.