Now that the oil flow has finally stopped, for now, the attention has…
-
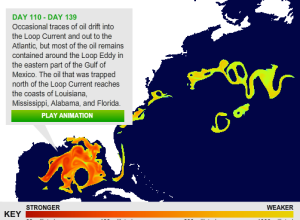
Where all the BP oil could end up
-

Military budget contextualized with CGI tanks
It’s no secret. The US military gets a lot of funding for manpower,…
-

Sorting algorithms visualized
This will be lost on many of you, but to the programmers this…
-
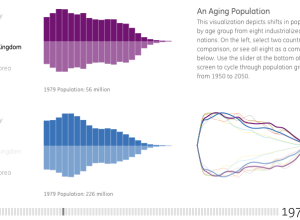
Exploration of our aging world
From Ben Fry’s newly established Fathom Information Design, is a visualization for GE…
-

Field guide to typographic moustaches
Sure, why not, let’s make it a hairy Friday. From Tor Weeks: a…
-

History of The Beatles as told by their hair
The Beatles were famously known for their mop-top haircuts in the early 1960s,…
-
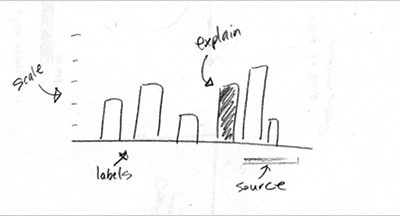
7 Basic Rules for Making Charts and Graphs
Charts and graphs have found their way into news, presentations, and comics, with…
-
Tardiness solves statistics theorems
Yeah, you read that right. Tardiness makes the world go ’round:
One day… -
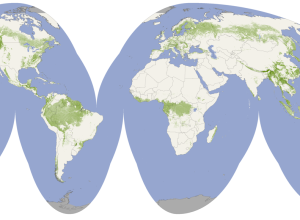
Global forest heights mapped in detail by NASA
NASA has mapped the world’s forest heights, based on satellite data, for a…
-
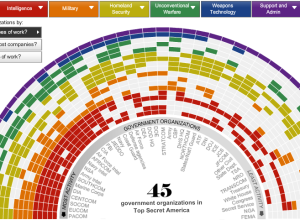
Investigation of top secret America
In response to the the 9/11 attacks, the United States government created a…
-
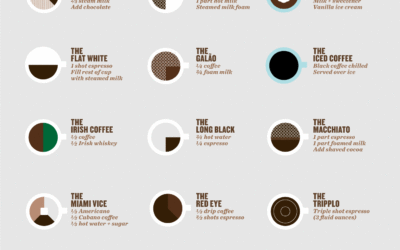
Citizen’s guide to fancy pants coffee drinks
In the same spirit of the original coffee drink infographic from a few…
-

Periodic table of swearing
I know you secretly love all information in periodic tables. It’s okay, you…
-

Maps that changed the world
Peter Barber, head of Map Collections at the British Library reports for the…
-
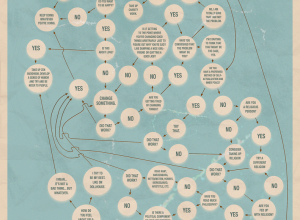
Path to happiness gets complicated and confusing
Just when you thought the path to lifelong happiness was uber simple and…
-
Federal CTO on government and data
Tim O’Reilly and Aneesh Chopra, Federal Chief Technology Officer sit down for a…
-
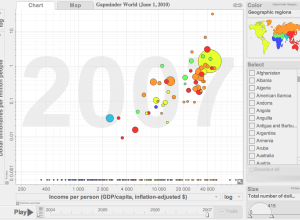
Gapminder makes its way to the desktop
You’ve seen the presentation. You’ve seen the motion graph tool. But up until…
-

How data travels from phone to computer
Time Warner Cable explains how a picture travels from Jeff’s phone to Vijay’s…
-
Best of FlowingData – June 2010
Thanks again, everyone for your retweets, likes, and stumbles. Every little bit helps…
-

Flowchart to lifelong happiness
The secret to lifelong happiness. If only it were so easy. [Typcut via…
-
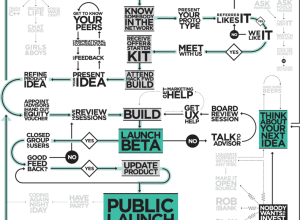
Flowchart shows the startup business cycle
Technology and investment group HackFwd describes what it’s like to work with them…
Recently for Members
Second Edition
 Visualize This: The FlowingData Guide to Design, Visualization, and Statistics (2nd Edition)
 Visualize This: The FlowingData Guide to Design, Visualization, and Statistics (2nd Edition)
New tools, refined process.
Browse by Chart Type See All →


