Spikes of (usually) equal width but varying height are centered on geographic areas. They are often used to show abnormally high counts in concentered regions.
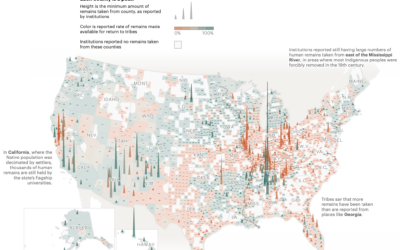
A law was passed in 1990 that allowed Native American tribes to request…
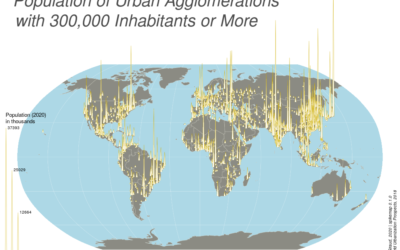
Spike maps use the height of spikes to encode data geographically. The format…
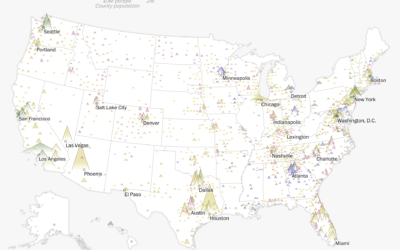
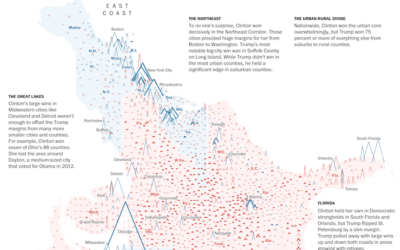
Using their peaks and valleys metaphor, The Washington Post shows the shift in…
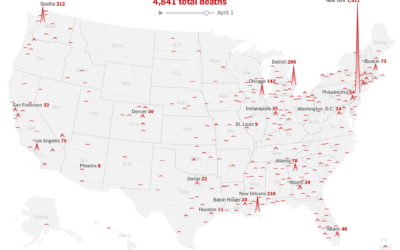
Going with the shaded triangle peaks to show case counts and deaths, The…
For The New York Times, Lazaro Gamio and Karen Yourish use an animated…
This is some fine map work by Lazaro Gamio and Dan Keating for…