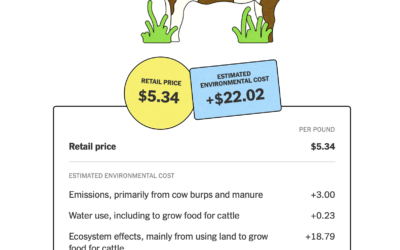
The New York Times highlights the work of True Price Foundation, a group…
environment
-
Environmental cost of food
-
Fashion industry’s environmental impact
For Bloomberg, Rachael Dottle and Jackie Gu look at the current state of…
-
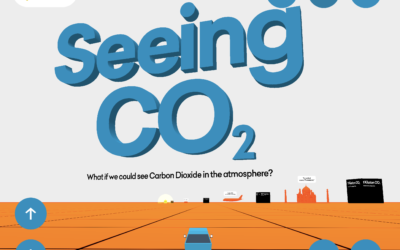
Seeing CO2 is a playable data visualization
Seeing CO2, by design studio Extraordinary Facility, is a playable data visualization that…
-
Amount of fish to raise a big fish
Raising living things requires resources. In the case of fish, it requires more…
-
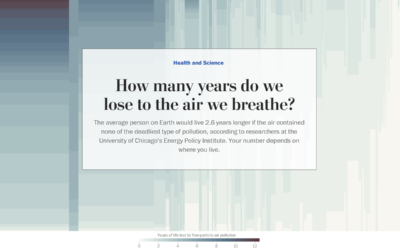
Years of life lost due to breathing bad air
Researchers at the University of Chicago’s Energy Policy Institute estimated the number of…
-
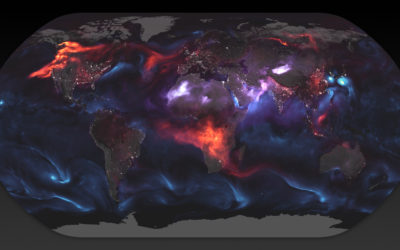
World map shows aerosol billowing in the wind
Using a mathematical model based on satellite data, NASA shows an estimate of…
-
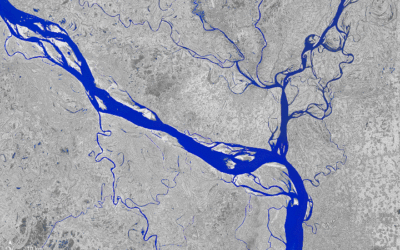
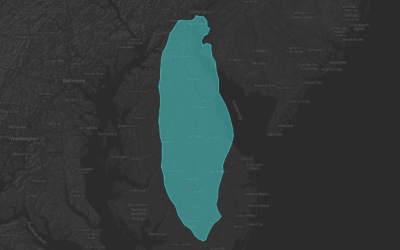
A transforming river seen from above
The Padma River in Bangladesh is constantly shifting its 75-mile path. Joshua Stevens…
-
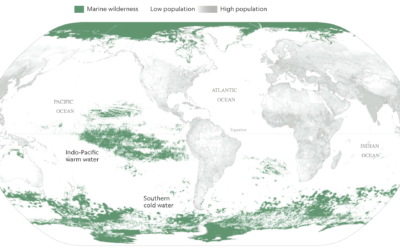
Mapping the ocean undisturbed by humans
Researchers recently published estimates for the amount of area undisturbed by humans —…
-
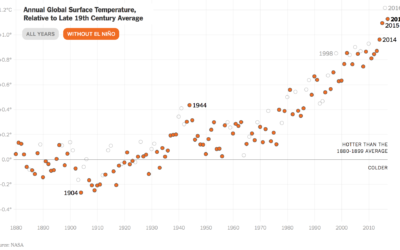
Surprise, the world was warmer again in 2017
According to NASA estimates, 2017 was the second warmest year on record since…
-
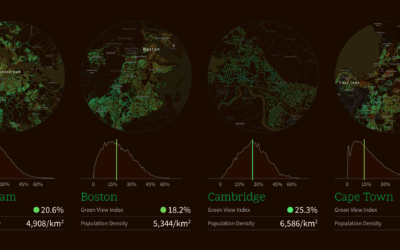
Mapping perceived canopy tree cover in major cities
Treepedia, from the MIT Senseable City Lab, estimates perceived tree cover at the…
-
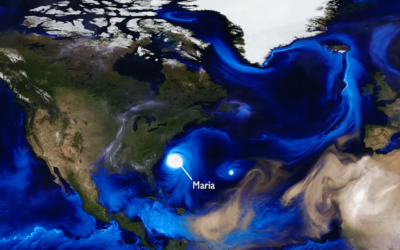
Simulation shows swirling of smoke, sea salt, and dust around the world
NASA. Data. Good.
Tracking the aerosols carried on the winds let scientists see… -
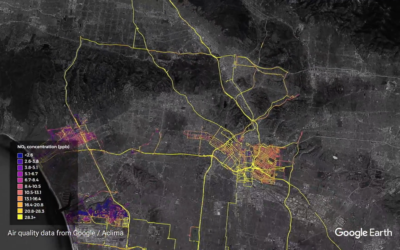
Google maps street-level air quality using Street View cars with sensors
Google equipped their Street View cars with air quality sensors and sent them…
-
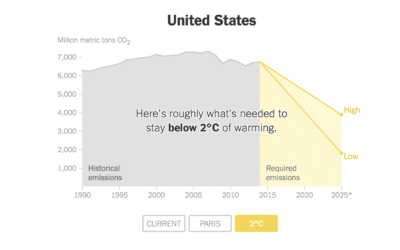
Carbon emissions goals vs. current paths
Brad Plumer and Nadja Popovich reporting for The New York Times:
Under the… -
Iceberg scale, as described in different countries
A giant iceberg broke off from Antartica. Like, really big. Quartz collected the…
-
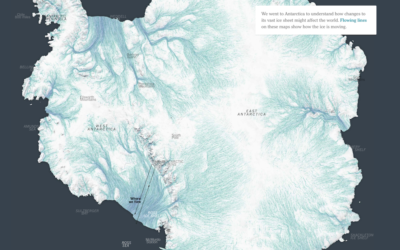
Moving ice
Ice in Antartica is in constant (very slow) motion, and as ocean waters…
-
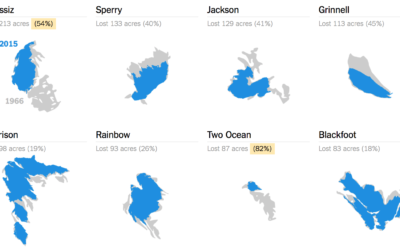
Melting glaciers
Glaciers at Glacier National Park in Montana are melting. Using data from the…
-
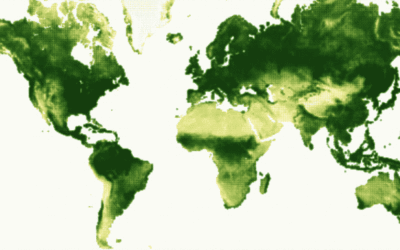
Breathing Earth of vegetation
Using data from NOAA STAR, Nadieh Bremer creates a breathing Earth that shows…
-
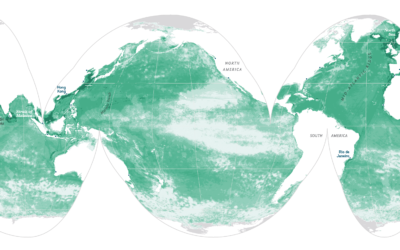
X-Ray of the oceans
Using satellite data and spatial models, researchers estimate human influence in the ocean.…
-
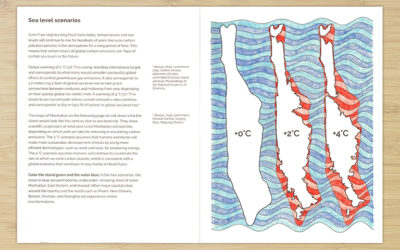
Climate Change Coloring Book
The Climate Change Coloring Book by Brian Foo makes data tactile and interactive.…
-
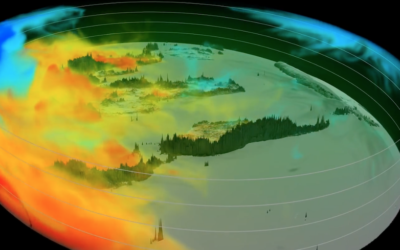
Following the carbon dioxide
This animated visualization from NASA Goddard Space Flight Center shows a model of…





 Visualize This: The FlowingData Guide to Design, Visualization, and Statistics
