• Membership
  • Newsletter
  • Projects
  • Learning
  • About
  • Member Login
  • Black mortality gap

    September 8, 2021

    Topic

    Infographics  /  Anna Flagg, mortality, race, Upshot

    Anna Flagg, for NYT’s The Upshot, used dots arranged as a stacked area chart to show the difference between two mortality rates. Each dot represents 10 people, and they start as a random cloud. A transition to show rate by age lends focus to both an absolute and relative count.

  • Bitcoin power usage

    September 7, 2021

    Topic

    Infographics  /  Bitcoin, electricity, New York Times

    You might have heard that Bitcoin uses a lot of electricity. More than some countries. You might have wondered how that could be possible. The New York Times explains with a set of graphics and illustrations.

  • Data Underload  /  home, time use

    How Much More Time We Spent at Home

    We had to do more from home. Here’s how much everything shifted by total minutes in a day.

    Read More
  • Members Only

    A Bar Chart Would Be Worse – The Process 155

    September 2, 2021

    Topic

    The Process  /  flexibility, insight

    Bar charts are the simple answer. Maybe you’re not looking for simple though.

  • New Orleans power outage seen via satellite imagery

    September 2, 2021

    Topic

    Maps  /  Hurricane Ida, lights, NASA, outage

    After Hurricane Ida, New Orleans experienced power outages. The NASA Earth Observatory show the outages by comparing night lights on August 31, 2021 against night lights on August 9, 2021:

    VIIRS has a low-light sensor—the day/night band—that measures light emissions and reflections. This capability has made it possible to distinguish the intensity, types, and sources of lights and to observe how they change. The data are then processed by the Black Marble team to account for changes in the landscape (such as flooding), the atmosphere, and the Moon phase, and to filter out stray light from sources that are not electric lights.

  • How Humans Judge Machines

    September 1, 2021

    Topic

    Statistics  /  book, interaction, machines

    How Humans Judge Machines is an academic publication covering the results of experiments on how humans judge machines. The digital version is free, or you can purchase a print version.

    How Humans Judge Machines compares the reactions of people in the United States to scenarios describing human and machine actions.
    Our data shows that people do not judge humans and machines equally, and that these differences can be explained as the result of two principles.

    First, people judge humans by their intentions and machines by their out- comes.

    By using statistical models to analyze dozens of experiments (chapter 6) we find that people judge machine actions primarily by their perceived harm, but judge hu- man actions by the interaction between perceived harm and intention. This principle explains many of the differences observed in this book, as well as some earlier findings, such as people’s preference for utilitarian morals in machines.

    The second principle is that people assign extreme intentions to humans and narrow intentions to machines.

  • Tracking wildfires in the west

    September 1, 2021

    Topic

    Maps  /  New York Times, tracker, wildfire

    Wildfires continue to burn in the western United States. The New York Times provides a tracker showing the ones burning now, along with air quality and a smoke forecast.

    A couple of weeks ago, it smelled of smoke in my area and the sky was orange. I guess this is the new norm.

  • AI-generated movie posters

    August 31, 2021

    Topic

    Data Art  /  AI, movies, neural network, Noah Veltman

    Noah Veltman fed an AI movie descriptions and made it generate images. The results are in quiz form so that you can guess the movies. I would give myself a poor rating for guessing the movies, but once you see the answer, you’re like oh yeah of course.

    Veltman used VQGAN+CLIP, which you can find out more about here.

  • Repulsive curves

    August 30, 2021

    Topic

    Visualization  /  curves, optimization, research

    Chris Yu, Henrik Schumacher, and Keenan Crane from Carnegie Mellon University are working on repulsive curves, which is a method to efficiently unravel curves so that they don’t overlap:

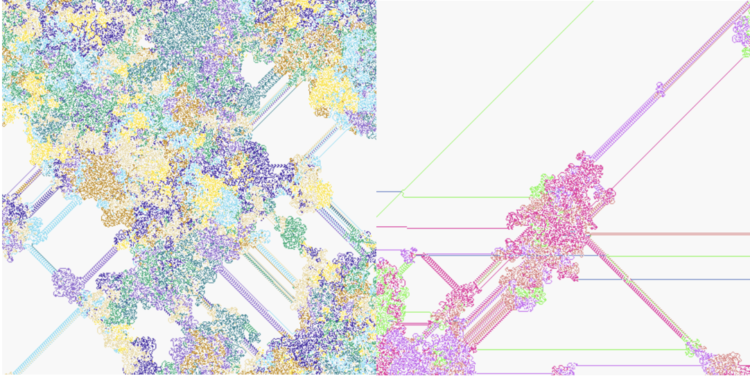
    Curves play a fundamental role across computer graphics, physical simulation, and mathematical visualization, yet most tools for curve design do nothing to prevent crossings or self-intersections. This paper develops efficient algorithms for (self-)repulsion of plane and space curves that are well-suited to problems in computational design. Our starting point is the so-called tangent-point energy, which provides an infinite barrier to self-intersection. In contrast to local collision detection strategies used in, e.g., physical simulation, this energy considers interactions between all pairs of points, and is hence useful for global shape optimization: local minima tend to be aesthetically pleasing, physically valid, and nicely distributed in space.

    Be sure to watch the video demo.

  • Lightning algorithm

    August 27, 2021

    Topic

    Statistical Visualization  /  algorithm, Matt Henderson, Numberphile

    [arve url=”https://www.youtube.com/watch?v=akZ8JJ4gGLs” loop=”no” muted=”no” /]

    Matt Henderson on Numberphile shows off a “lightning algorithm” which is actually a maze-solving algorithm that shows the solution at the end. Come for the demo at the beginning but stay for the explanation.

  • Members Only

    Visualization Tools and Learning Resources, August 2021

    August 26, 2021

    Topic

    The Process  /  roundup

    Here’s the good stuff for August.

  • Data Underload  /  time use

    Cycle of Many, a 24-hour snapshot for a day in the life of Americans

    This is a 24-hour snapshot for a day in the life of Americans.

    Read More
  • Machine learning explained at five difficulty levels

    August 25, 2021

    Topic

    Statistics  /  Hilary Mason, machine learning, Wired

    [arve url=”https://www.youtube.com/watch?v=5q87K1WaoFI” loop=”no” muted=”no” /]

    For their 5 Levels series, Wired brought in Hilary Mason to explain machine learning at five levels of difficulty. Mason’s explanations are super helpful at every level.

  • Diversity within the Asian population

    August 24, 2021

    Topic

    Maps  /  Asian, diversity, New York Times

    Robert Gebeloff, Denise Lu and Miriam Jordan for The New York Times looked at overall increases and variation within the Asian population:

    North Dakota, South Dakota, Texas, North Carolina and Indiana are among states that experienced major growth in the past decade. And people of Asian descent have been settling in ever larger numbers in states like West Virginia, where the overall population has declined.

  • Inflation isn’t that exciting

    August 23, 2021

    Topic

    Statistical Visualization  /  inflation, New York Times

    For NYT Opinion, Josh Bivens and Stuart A. Thompson argue that you don’t need to panic about inflation:

    It may surprise many Americans that even during times of strong growth and very low inflation (like the late 1990s) or weak growth and low inflation (like the years following the Great Recession), more than half of all goods and services are usually experiencing price increases. In part, this is because it is awfully hard for employers to cut nominal wages, even in a recession. And economists see some mild, steady economy-wide inflation as a sign of a healthy economy. The Fed, for instance, actively targets an average overall inflation level of 2 percent per year.

    I like the mini visual cues in the body text so that you don’t have to scroll or refer back to the full chart to see what they’re talking about.

  • NBA carry jobs

    August 20, 2021

    Topic

    Statistical Visualization  /  basketball, Pudding, Russell Goldenberg

    With professional basketball, we often hear about carry jobs. There’s one star player who carries everyone else to a championship. Russell Goldenberg for The Pudding looked for the biggest carry jobs in NBA Finals history.

  • Members Only

    Different Points of View from the Same Data – The Process 153

    August 19, 2021

    Topic

    The Process  /  purpose, questions, tradeoffs

    It still amazes me that you can give multiple people the same dataset and the results can vary depending on questions, goals, and audience.

  • Data Underload  /  routine, time use

    Daily Routine, 2020

    After looking at how much time we spent on daily activities in 2020, let’s look at when we spent our time.

    Read More
  • Generative art with R

    August 18, 2021

    Topic

    Software  /  generative art, R

    Generative art seems to be having a moment right now, so it’s only appropriate that there’s an R package to help you make some. The aRtsy package by Koen Derks makes algorithms more straightforward to use. Set parameters and you’re off.

  • How vaccines can make a difference with the Delta variant

    August 17, 2021

    Topic

    Infographics  /  coronavirus, Delta variant, Lauren Letherby, New York Times, vaccination

    We see percentages for the vaccinated and unvaccinated, and people can easily misinterpret or miscommunicate the results. It’s especially problematic when people are actively trying to confirm misconceptions. For The New York Times, Lauren Leatherby tries to make things clearer imagining two groups: one that is 20% vaccinated and one that is 95% vaccinated.

    Vaccines work.

  • Page 75 of 391
  • <
  • 1
  • ...
  • 72
  • 73
  • 74
  • 75
  • 76
  • 77
  • ...
  • 391
  • >

Analyze, visualize, and communicate data usefully, beyond the defaults.

Become a member →

Recently for Members

May 8, 2025
When the data is not what it seems

May 1, 2025
Finding the Right Charts

April 24, 2025
Visualization Tools, Datasets, and Resources – April 2025 Roundup

April 17, 2025
Breaking Out of Chart Software Defaults

April 15, 2025
Line Chart with Decorative Neon Accents

Browse by Chart Type See All →

Histogram Spike Map Square Pie Chart Cartogram Box Plot Slope Chart Unit Chart Pyramid Chart Glyph Chart Donut Chart

Browse By Topic

  • Visualization

    Seeing data

  • Maps

    Seeing geographic data

  • Infographics

    Explaining data

  • Networks

    Connecting data

  • Statistics

    Analyzing data

  • Software

    Working with data

  • Sources

    Getting data

  • Design

    Making data readable

Get the Book

Visualize This: The FlowingData Guide to Design, Visualization, and Statistics

Available now.

Order: Amazon / Bookshop

Made by FlowingData

  • The Process

  • Data Underload

  • Chart Everything

  • Guides

  • Books

  • Shop

  • About
  • Contact
  • Newsletter
  • LinkedIn
  • Instagram
  • Bluesky
  • RSS
Copyright © 2007-Present FlowingData. All rights reserved.