You spent time and effort on a data project and it ends up in unexpected places. Do you just shrug and let it pass or do you try to get a handle on the work so that it’s not misconstrued out of context?
purpose
-
Members Only
Unexpected Places
-
Members Only
Pushing Out the Charts
In the land of what-if and what-about, it’s surprisingly easy to get stuck staring at your work, thinking about how your audience will hate it. You have to let it go.
-
Members Only
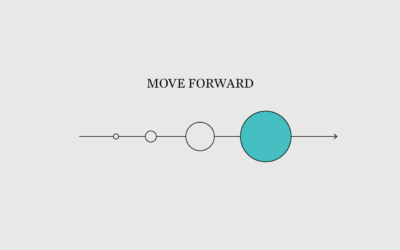
Making Dents
Every now and then, the work can feel like too much, but that usually means I’ve lost sight of the point.
-
Members Only
Eggtastic Graph
It is okay to fill the void with something fun.
-
Members Only
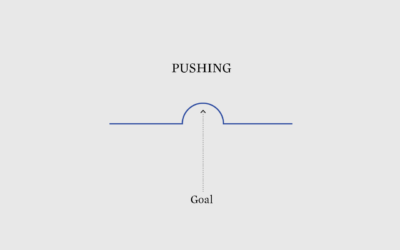
Finding the Point
Visualization for the sake of visualization is a drag and fleeting. Find purpose for your work.
-
Members Only

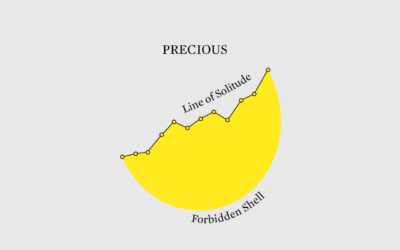
This Time With Purpose
Without purpose, there isn’t a whole lot to grasp on.
-
Members Only
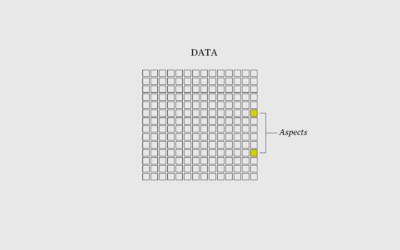
I Want to Visualize Aspects of the Data – The Process 162
When you visualize aspects of the data instead of just the data itself, what you show grows more obvious.
-
Members Only
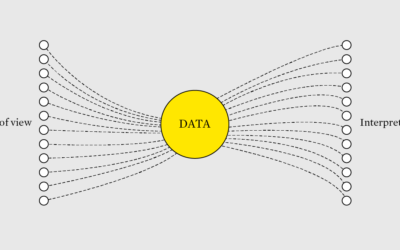
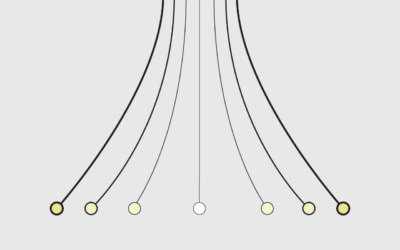
Different Points of View from the Same Data – The Process 153
It still amazes me that you can give multiple people the same dataset and the results can vary depending on questions, goals, and audience.
-
Members Only
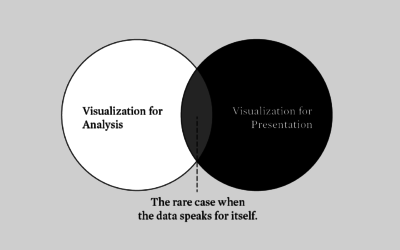
Analytical Stand-in – The Process 146
There’s visualization for analysis. There’s visualization for presentation. There’s overlap between the groups, but the differences require a varied approach.
-
Members Only

More Colors vs. Fewer Colors – The Process 127
The two approaches answer two different questions.
-
Four Cs of data and design
Ben Fry using the “tropiest of design tropes”, describes his goals for visualization.…
-
Members Only
Make It Mean Something or It Didn’t Happen
Visualization as template-filling content is lazy visualization that no one draws benefit from. Give people a reason to care.
-
Members Only
Detailed Intentions of a Map, When Everything Leads to Nothing, Designing for Misinterpretations
The New York Times published an election map. A lot of people did not like the map, arguing that it was an inaccurate representation. Those who did like the map argued that one must consider intent before throwing a map to the flames.
What happens when intended use and actual use do not match up?
Recently for Members
Second Edition
 Visualize This: The FlowingData Guide to Design, Visualization, and Statistics (2nd Edition)
 Visualize This: The FlowingData Guide to Design, Visualization, and Statistics (2nd Edition)
New tools, refined process.
Browse by Chart Type See All →


