Daily Routine, 2020

After looking at how much time we spent on daily activities in 2020, let’s look at when we spent our time. Based on data from the American Time Use Survey, the chart below shows the percentage of people doing activities on a non-holiday weekday.


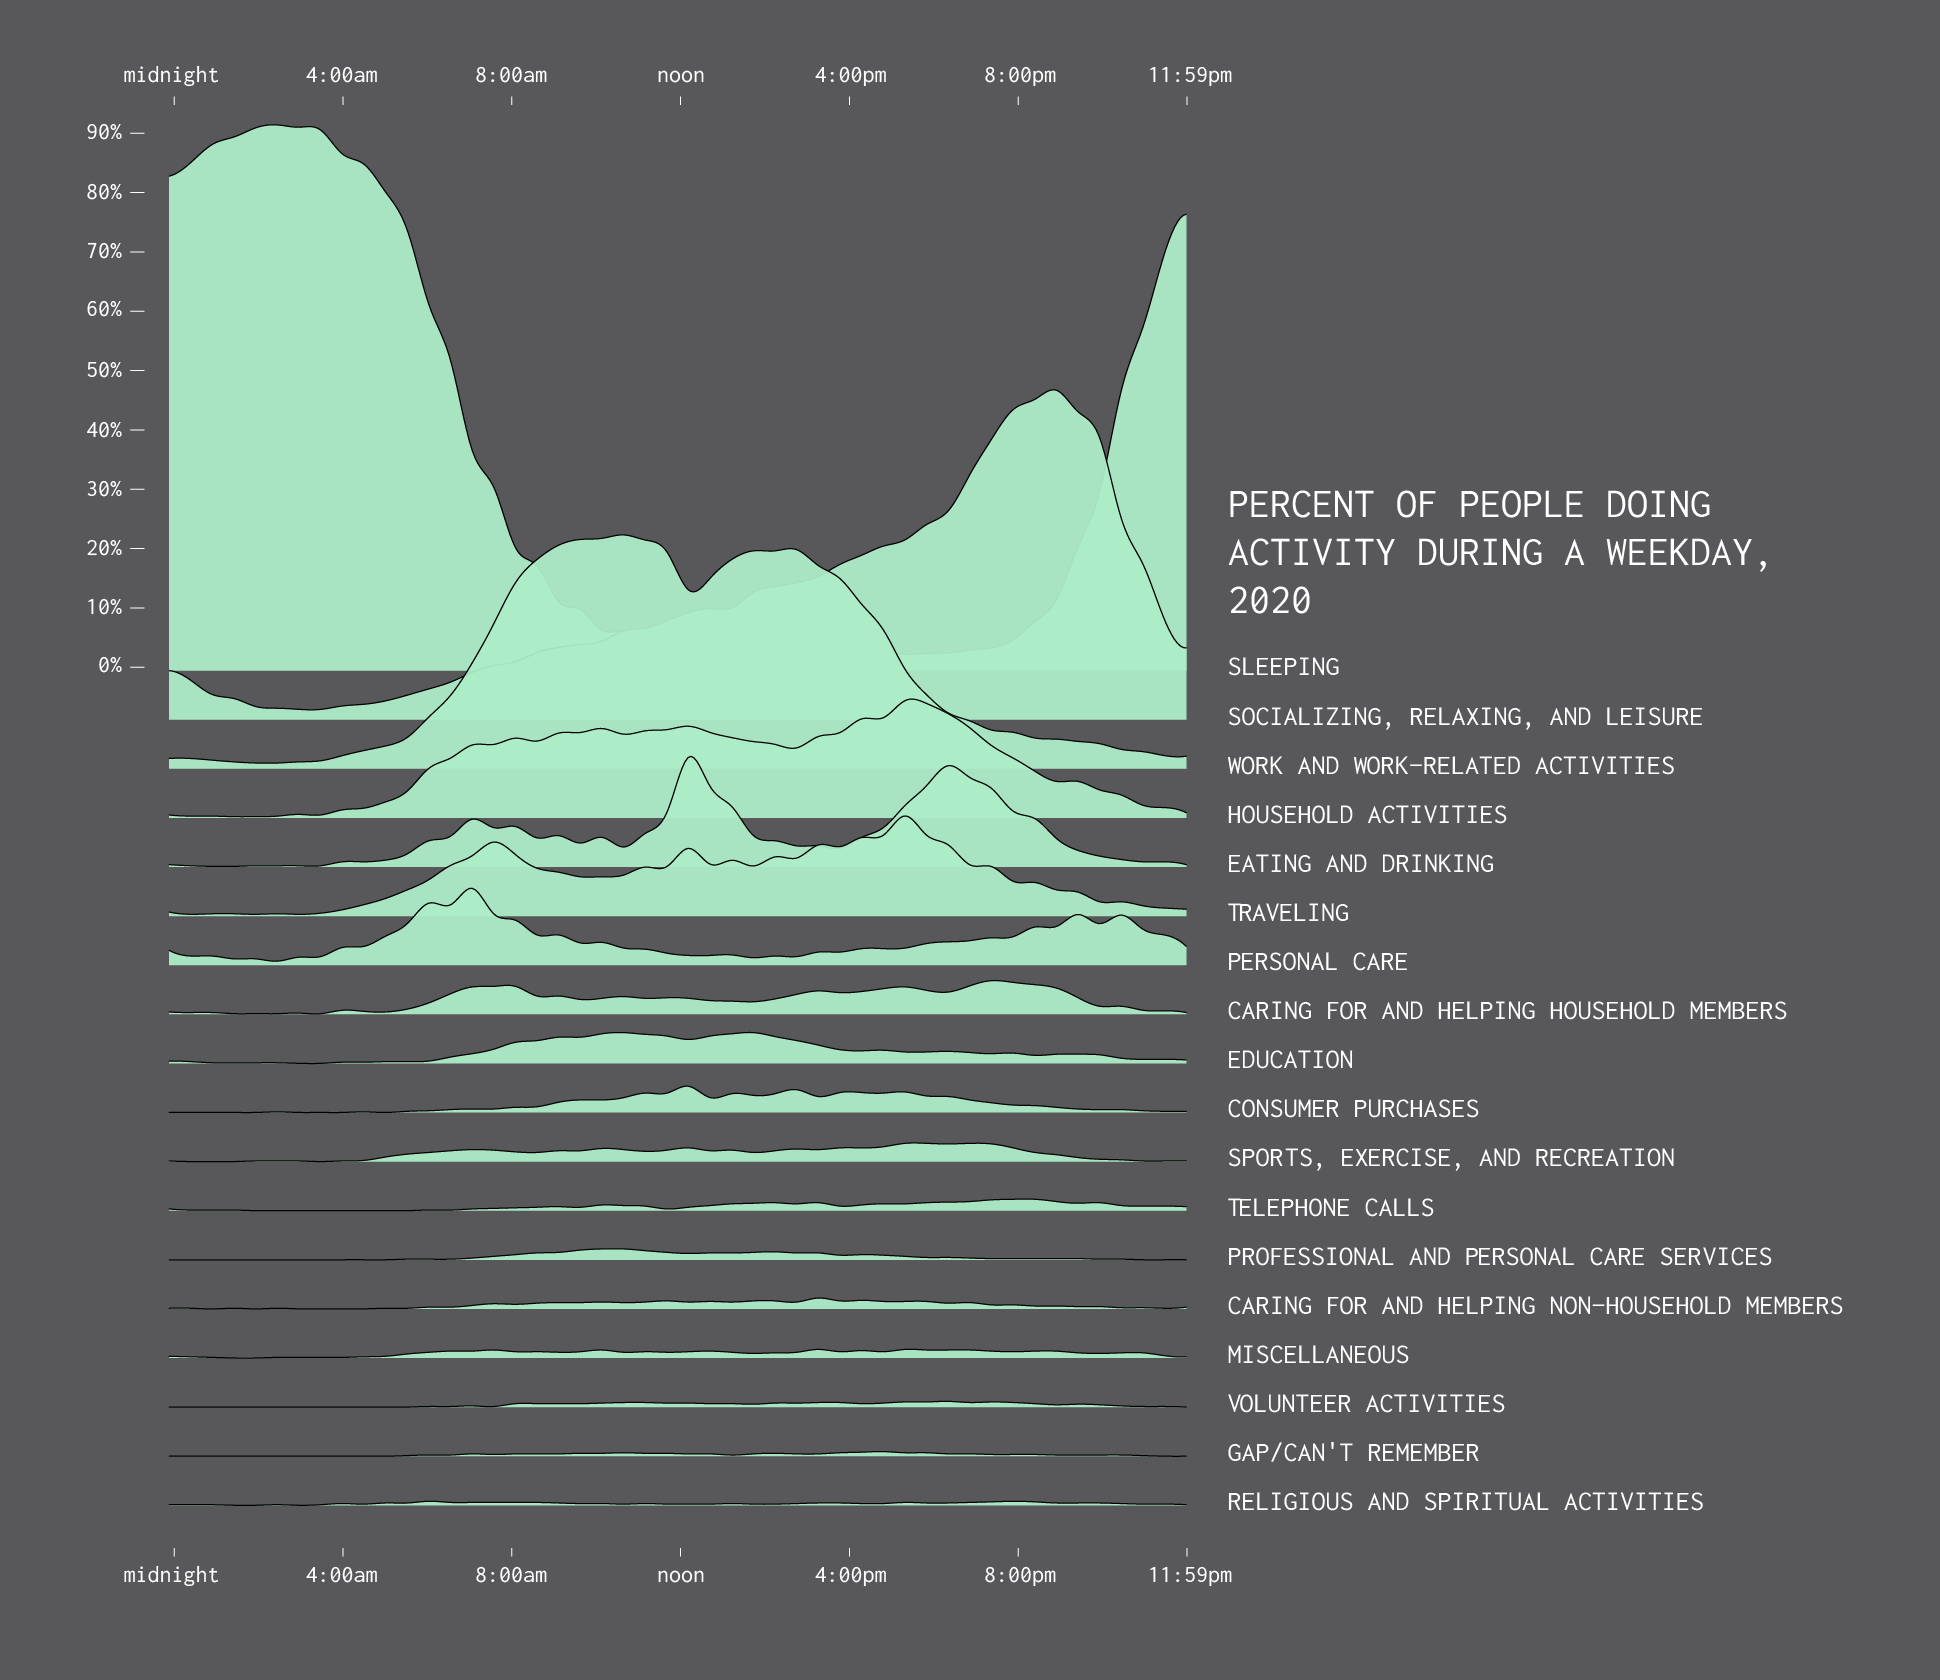
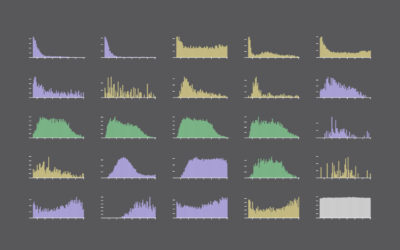
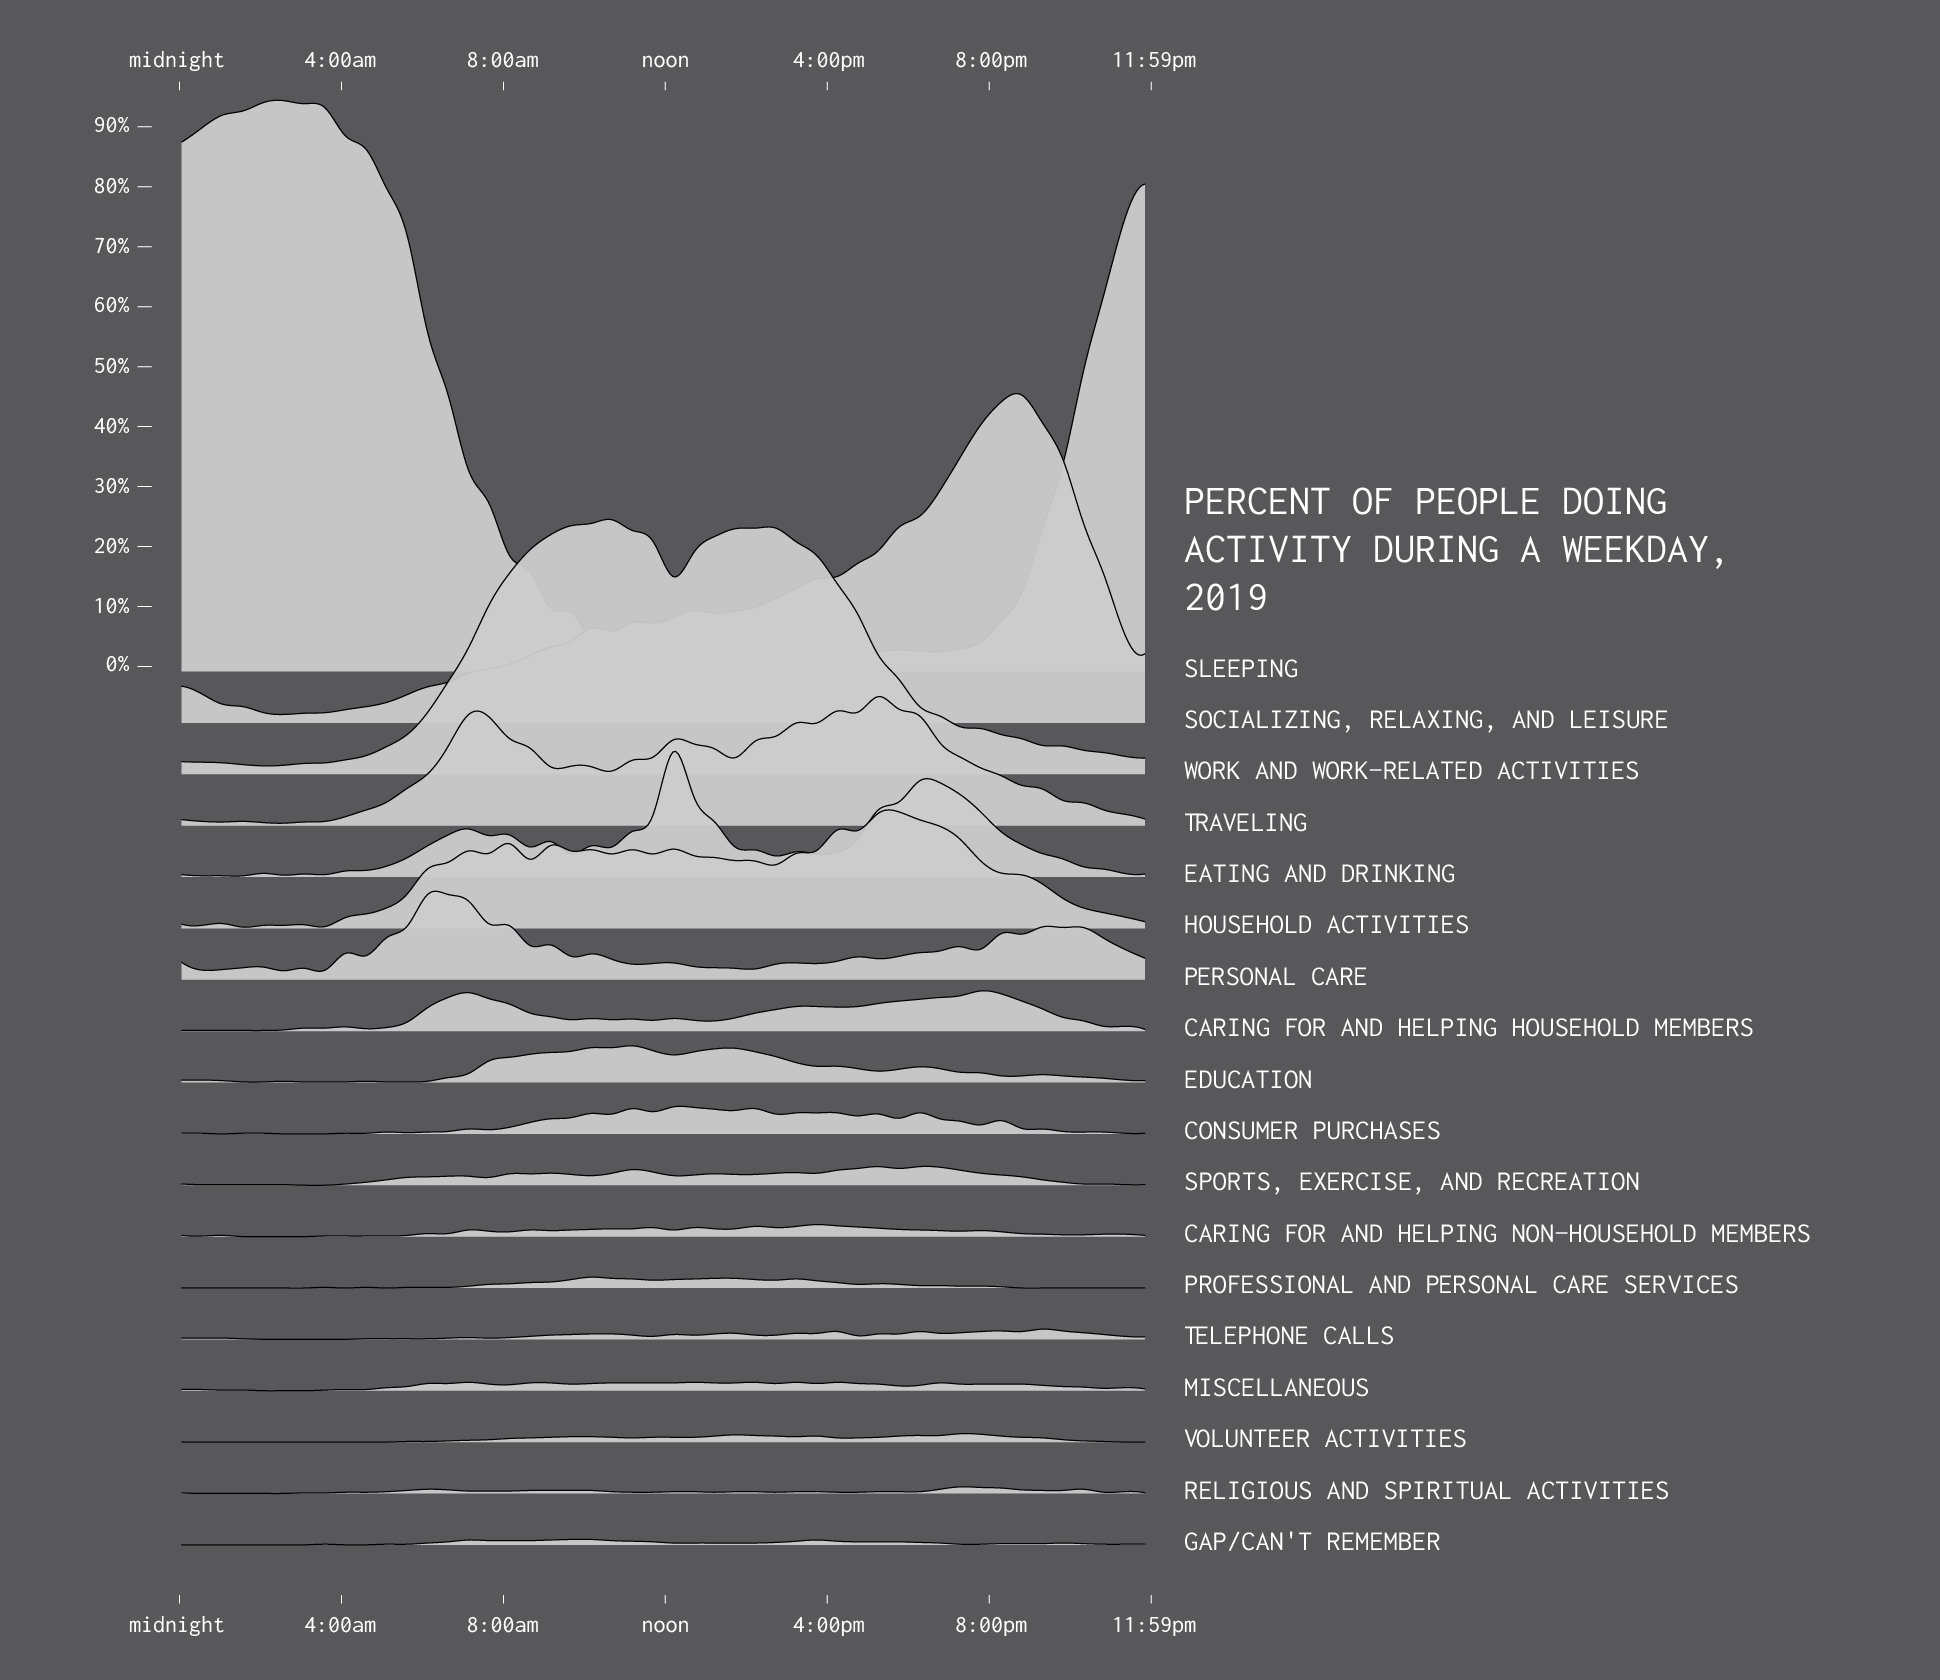
This doesn’t look all that different from 2019 distributions, shown below. Sleep peaks during the late night hours; socializing and relaxing peaks during the evening hours; eating and drinking peak during lunch and dinner.


Although it’s kind of hard to compare between the two years with the separate views, so here’s 2020 overlaid on 2019 time use:


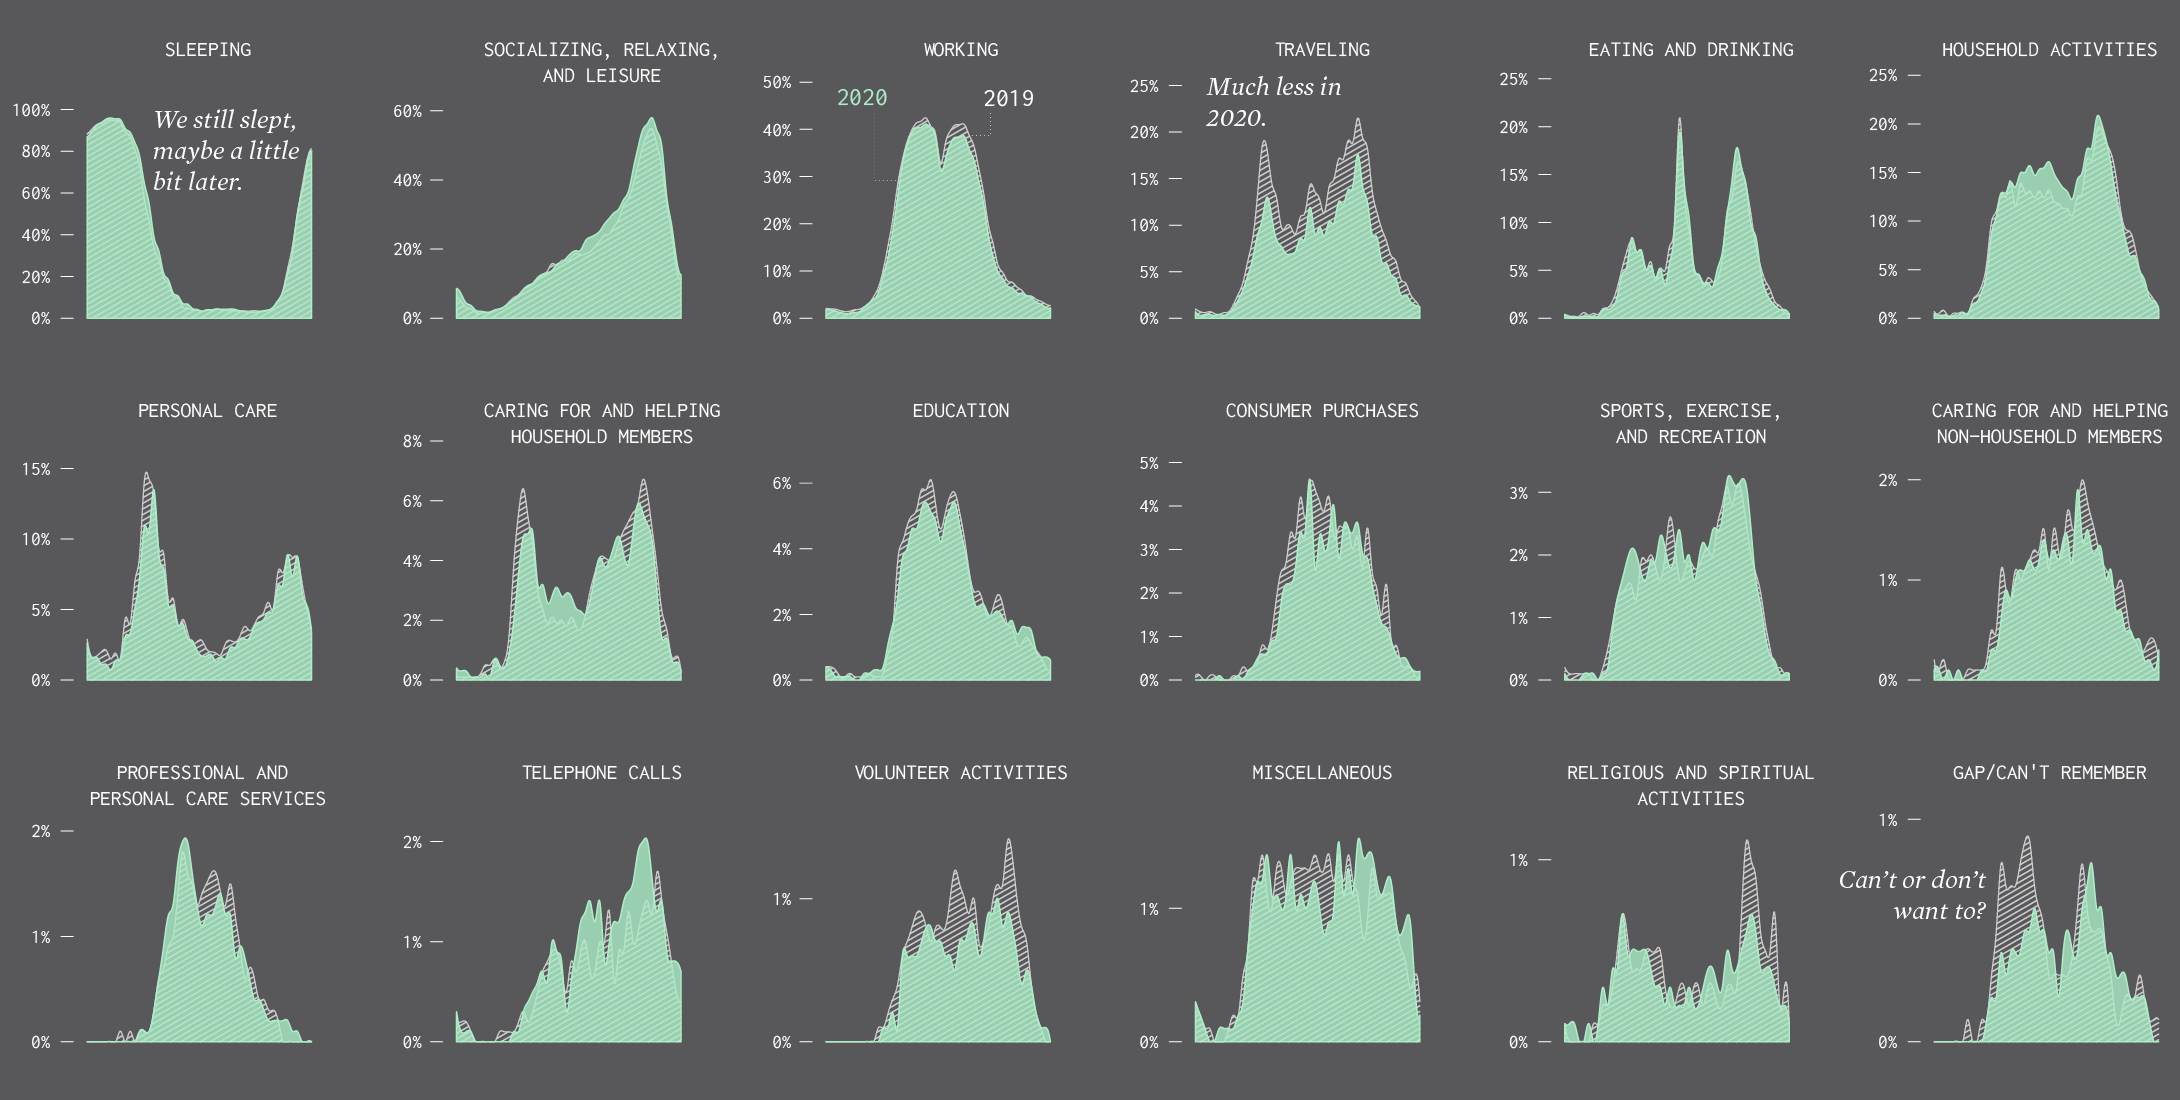
Some activities were down noticeably in 2020: traveling, volunteering, shopping, and religious activities. Caring for household and non-household members was also down, but I suspect a big chunk of that comes from decreased waiting and commuting related to those activities.

Household activities and telephone calls were up, which seems right.

Overall, the distributions over the day don’t look that different between 2020 and 2019. I thought there would be more variation between the two.

I have a feeling that this breakdown of activities is only part of the story though. Maybe where these activities were down, at home versus somewhere else, is a good next step. Maybe looking at secondary activities (these are primary) is also worthwhile to see how people had to do more at once (like take care of kids while working).

Notes

The data comes from the American Time Use Survey, which is run by the Bureau of Labor Statistics. I downloaded microdata via IPUMS. I made the charts with R and Adobe Illustrator.


Become a member. Support an independent site. Make great charts.

See What You Get

Learn to Visualize Data See All →

How to Make and Use Bar Charts in R

The chart type seems simple enough, but there sure are a lot of bad ones out there. Get yourself out of default mode.

How to Make Slopegraphs in R

Also known as specialized or custom line charts. Figure out how to draw lines with the right spacing and pointed in the right direction, and you’ve got your slopegraphs.

How to map connections with great circles

There are various ways to visualize connections, but one of the most intuitive and straightforward ways is to actually connect entities or objects with lines. And when it comes to geographic connections, great circles are a nice way to do this.

More on Making Heat Maps in R

You saw how to make basic heat maps a while back, but you might want more flexibility for a specific data set. Once you understand the components of a heat map, the rest is straightforward.

Favorites

Causes of Death

There are many ways to die. Cancer. Infection. Mental. External. This is how different groups of people died over the past 10 years, visualized by age.

How the American Work Day Changed in 15 Years

The American Time Use Survey recently released results for 2018. That makes 15 years of data. What’s different? What’s the same?

Cycle of Many, a 24-hour snapshot for a day in the life of Americans

This is a 24-hour snapshot for a day in the life of Americans.

The Most Gender-Switched Names in US History

We use some names mostly for boys and some mostly for girls, but then there is a small percentage that, over time, switched from one gender to another. Which names made the biggest switch?