
People die, and for various reasons many bodies go unclaimed. In Los Angeles county, the bodies go to the county crematory. The Los Angeles Times reports, along with a searchable database of the unclaimed in 2011.
If relatives can be found, they are notified by the morgue or the coroner that their loved one’s body is available for pickup by a mortuary. If a family can’t afford the mortuary fees, the county handles cremation.
The cost is typically $352 for a case handled by the coroner and $466 for others. Although that must be paid before the ashes can be taken, in some cases a family can ask a county supervisor to waive the fee.
Some families simply don’t want to pick up relatives, said Joyce Kato, an investigator at the Los Angeles County coroner’s office.
The county keeps remains for three years, so the ashes will receive a mass burial if they are not claimed by the end of this year.
Oof, the remains of 137 unclaimed babies in the database and the drawer of paper bags with their remains struck a chord.


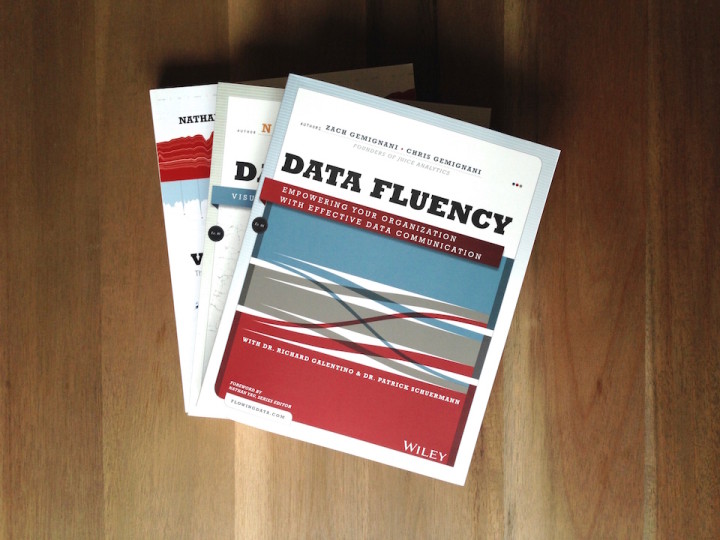
 Visualize This: The FlowingData Guide to Design, Visualization, and Statistics (2nd Edition)


