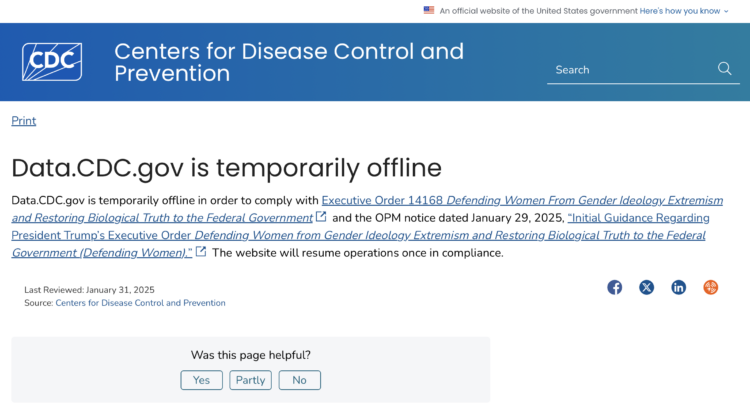
• Membership
  • Newsletter
  • Projects
  • Learning
  • About
  • Member Login
  • Presidential election still a toss-up

    October 15, 2024

    Topic

    Statistics  /  election, Nate Silver, probability, uncertainty

    You’re probably going to see election forecasts more this month, and one candidate will have a higher chance of winning than the other. Even so, it won’t mean much, because the forecast is basically a coin flip. Nate Silver explains the chances in the context of gambling:

    Gamblers understand this, perhaps like nobody else. Yes, if you think Harris is really a 55/45 favorite and prediction markets have it the other way, you have a profitable wager — but you’re still going to lose the bet almost half the time. (There have been much bigger discrepancies between models and prediction markets in the past.) In sports betting, the breakeven point on a point spread bet is generally 52.5 percent — that’s just enough to cover the vig — but most experienced bettors would avoid the 53/47 games1 to reduce variance and because there’s ultimately no way to know that your model is right. In poker, you can’t avoid making tough decisions — you always have to fold, raise/bet, or check/call — but many decisions in the game are so close that you’re literally supposed to randomize your play, employing a mixed strategy because being unpredictable outweighs any slight edge from one line being superior to another.

  • Election of random chance

    October 14, 2024

    Topic

    Statistics  /  election, gambling, New Yorker, random, uncertainty

    For The New Yorker, Jay Caspian Kang relates the election’s unwavering randomness to choices while gambling that probably don’t matter:

    Forgive the jargon, but if you’re dealt an ace and a queen—a strong starting hand—in the big blind, and face a mid-position open, the best strategy, according to G.T.O. poker, is to three-bet x percentage of the time and just call the other times. What this means is that you can call or raise and both options are correct, as long as, over time, they’re in line with a rolling calculation of percentages. As a result, there’s a Zen to the modern poker strategy, which may be why I often watch these videos late at night when I can’t sleep. I especially appreciate the commentary of Phil Galfond, a personable former professional poker player, who now makes videos in which he says things like “In this spot, you can fold sometimes, call sometimes, and raise sometimes, and it’s probably fine.”

    This is probably not the last gambling metaphor you’ll read this month.

  • Who gets shipped in fan fiction

    October 14, 2024

    Topic

    Infographics  /  fiction, Pudding, relationships, shipped

    The Pudding examines who gets shipped, which means a pairing of characters in a relationship. Relationship types, demographics, and fandoms. Completely uninitiated to the world of fan fiction, I did not know many words going into this, but now I do.

  • Restaurant preferences via campaign spending

    October 11, 2024

    Topic

    Statistical Visualization  /  election, restaurant, spending, Washington Post

    For WP’s Department of Data, Kati Perry and Adrián Blanco examine campaign spending through the lens of restaurant and cuisine preferences between political parties:

    [W]e wanted to wrap our arms around a bigger question: where the campaigns spend the most money. We limited our analysis to places that racked up at least $5,000 in campaign spending, coming up with a list of roughly 500 popular restaurants and food purveyors, involving more than 21,000 receipts worth a collective $13 million.

    See also the Department of Data’s previous party split analysis on names. They should do the thing where with each analysis, they go more and more ridiculous so that by election day they’re counting letter usage in rally speeches.

  • Uber and Lyft use lockout loophole to avoid paying drivers

    October 10, 2024

    Topic

    Infographics  /  Bloomberg, Lyft, minimum wage, Uber

    Based on rideshare data collected by Bloomberg, it appears that Uber and Lyft are using a loophole to avoid paying drivers a minimum wage in New York. They lock out drivers throughout the day to reduce paying out of pocket. The rideshare companies said they only do this during busy times, but the Bloomberg analysis shows that lockouts happen almost every hour:

  • Three flavors of luck

    October 10, 2024

    Topic

    Statistics  /  David Spiegelhalter, luck, randomness

    For The Guardian, statistician David Spiegelhalter describes three kinds of luck:

    1. Circumstantial luck — Right place, right time or wrong place, wrong time
    2. Outcome luck — Randomness outside your control
    3. Constitutive luck — A series of events leading up to the present

    He emphasizes the third with a story about his existence that starts with his grandfather surviving the war and then his parents in a cold winter:

    Of course, if one of those shells had fallen a bit closer, or if my grandfather had had to lead his men into attack, I would not be here to tell the story. And this is only one of the long chain of fortuitous events that led to my existence: my mother being captured by pirates in China and later escaping Shanghai in 1937 under shellfire; my parents meeting during the war; my father closely avoiding plane crashes in the RAF and then nearly dying of tuberculosis. Then, when a cold snap hit the UK in November 1952, they were living in a barely heated stone cottage, with no television and nothing to do but go to bed early to keep warm … and here I am.

    Spiegelhalter is very good at communicating statistics to the public. He has a new book on uncertainty already out in the United Kingdom and available for pre-order in the United States.

  • Hurricane Watch

    October 9, 2024

    Topic

    The Process  /  hurricane, possibilities, uncertainty

    Hey, it’s Nathan Yau. This is The Process, the weekly newsletter for FlowingData members. We look at the many ways to visualize data and how design choices can change a message and interpretation. I’m a little early this week. Given the topic and situation in Florida, I’m making this issue public.

    Read More

  • Seen from space: Hurricane Milton approaches

    October 8, 2024

    Topic

    Maps  /  hurricane, NOAA, satellite imagery

    NOAA has a viewer for their GOES (Geostationary Operational Environmental Satellite) system, which provides current imagery from space. The images update every five minutes, and you can see different bands at different times for different locations.

    This is the current view for the Gulf of Mexico where you can see Hurricane Milton approaching Florida:

  • Hurricane Milton potential threats

    October 8, 2024

    Topic

    Maps  /  Bloomberg, flood, hurricane, uncertainty

    Hurricane Milton continues towards Florida, estimated to make landfall on October 9, 2024 in the evening. This means potential for storm surges, high winds, flooding, and tornadoes. Instead of trying to put this all on one map, Bloomberg put together a collection of maps to track Milton.

    Each map shows potential for a threat, and as you pan one map, the rest go with it.

  • FlowingData Membership Update

    October 8, 2024

    Topic

    Site News

    Short version: Members make FlowingData possible, and it’s a lot easier to support through membership now. There are two new plans: Deviation and the upgraded Outlier. The Outlier plan is for those who want to support the site more, and as a bonus, you get a signed copy of Visualize This (2nd ed.).

    Help me keep this site running forever, and get access to courses, tutorials, and the members-only newsletter. Fun data things are in the queue.

    Longer version: FlowingData is 17 years old and has been almost entirely supported by paid memberships for the past 12. An eternity in internet years. Thanks to you all.
    Read More

  • Preparing for a hurricane, a visual guide

    October 8, 2024

    Topic

    Infographics  /  emergency, hurricane, Washington Post

    For The Washington Post, N. Kirkpatrick, Aaron Steckelberg, and Leslie Shapiro provide a visual guide for what to do before, during, and after a hurricane. The guide was originally published in 2023, but Hurricane Milton is headed towards Florida, expected to make landfall on Wednesday or Thursday. It just reached category 5 strength. Stay safe, Floridians.

  • Rise in drug overdose deaths, led by fentanyl

    October 7, 2024

    Topic

    Statistical Visualization  /  drugs, fentanyl, mortality, New York Times, overdose

    Deaths by drug overdose in the United States increased sharply over the past decade, but a small shift downwards appeared over the past couple years. Just not equally everywhere. For NYT Opinion, Maia Szalavitz with graphics by Sara Chodosh and Aileen Clarke, show the changes between 2000 and 2023 and how it has varied by region.

    A set of alluvial diagrams show the change in deaths per 100,000 people in the Northeast, Midwest, South, and West of the United States. The West appears to be experiencing the tail end of the rise in fentanyl.

  • Political search interest in 2024

    October 4, 2024

    Topic

    Statistical Visualization  /  election, Google Trends, Moritz Stefaner

    In a follow-up to the 2020 project, Moritz Stefaner and Google Trends show geographic and temporal search patterns for this election year in Waves of Interest.

    This site presents Google Trends data on a curated set of political topics, comprising the currently most searched political concepts in the United States, topics from Pew Research Center’s election surveys, as well as a few manual additions to account for emerging issues.

    Election-related graphics tend to make me feel a bit anxious, but the smooth transitions in time and space in this set of graphics is actually kind of soothing.

  • Smuggling fentanyl precursors, illustrated

    October 4, 2024

    Topic

    Infographics  /  drugs, fentanyl, Reuters

    In their ongoing series on fentanyl in the United States, Reuters illustrates the journey of fentanyl precursors hidden among billions of everyday shipments. The volume of boxes, despite various layers of security, makes it impossible to intercept all illicit materials.

    There are charts blended with the illustrations that you might miss if you’re just casually browsing, such as the treemap made of boxes shown above. The style reminds me of the hidden-object illustrations in kid magazines.

  • Helene power outages mapped

    October 3, 2024

    Topic

    Maps  /  Atlas Guo, hurricane, outage, power

    Chenxiao Guo, a PhD candidate in geography who goes by the name Atlas, made a quick comparison between satellite images to highlight places without power due to Hurricane Helene. Blue shows the path.

  • Members Only

    Communicating Probability and Odds to People

    October 3, 2024

    Topic

    The Process  /  forecast, Nate Silver, odds, probability

    As election day in the United States draws closer, the probabilities, odds, and forecasts are in full swing, which gives us a chance to check the ways in which we currently communicate the fuzzy numbers.

  • Maps showing migration out of cities

    October 3, 2024

    Topic

    Maps  /  cities, climate, migration, New York Times

    Mira Rojanasakul and Nadja Popovich, for The New York Times, mapped migration out of cities between 2020 and 2023. The dot density maps show where more people moved out than in as orange dots and the opposite in green. For many, this has meant more space and lower cost of living in exchange for moving closer to areas with higher natural disaster risk.

  • Data Underload  /  age, work

    Jobs of a Certain Age

    There are hundreds of occupations, and while the exact number varies by classification system, most U.S. government organizations list about 500 of them. You can probably guess at least a handful of the most common. Cashiers. Drivers. Teachers.

    It gets more interesting the further down the list you go, breaking it down by demographic. You get a more accurate picture of the occupations throughout our lives.

    Read More
  • Jimmy Carter’s longevity compared to other U.S. presidents

    October 1, 2024

    Topic

    Statistical Visualization  /  age, Jimmy Carter, president, Washington Post

    Jimmy Carter, the 39th president of the United States, turned 100 years old. For The Washington Post, Hannah Dormido and Kevin Uhrmacher show how that compares the other presidents.

  • Reordered baseball lineup over decades

    October 1, 2024

    Topic

    Infographics  /  baseball, lineup, Pudding

    Baseball’s batting lineup has changed from what seemed to make sense to what the numbers show as optimal. Neil Paine and Michelle Pera-McGhee for The Pudding show the shifts.

    No place in the lineup showcases how the game has changed more than the No. 2 slot. Remember how the second spot in the order used to be all about making contact and moving runners over? Now, the data say that your best overall hitter should hit second rather than third, as originally believed. At the No. 2 spot, they will come to the plate more often, and less frequently with two outs. This is why better overall hitters — and especially better power hitters, like Trout, Seager, and Ohtani, hit in the 2-hole more than they ever did in the past.

  • Page 17 of 392
  • <
  • 1
  • ...
  • 14
  • 15
  • 16
  • 17
  • 18
  • 19
  • ...
  • 392
  • >

Analyze, visualize, and communicate data usefully, beyond the defaults.

Become a member →

Recently for Members

May 8, 2025
When the data is not what it seems

May 1, 2025
Finding the Right Charts

April 24, 2025
Visualization Tools, Datasets, and Resources – April 2025 Roundup

April 17, 2025
Breaking Out of Chart Software Defaults

April 15, 2025
Line Chart with Decorative Neon Accents

Browse by Chart Type See All →

Network Graph Moving Bubbles Stacked Bar Chart Slope Chart Connected Scatter Plot Pictogram Venn Diagram Voronoi Diagram Difference Chart Small Multiples

Browse By Topic

  • Visualization

    Seeing data

  • Maps

    Seeing geographic data

  • Infographics

    Explaining data

  • Networks

    Connecting data

  • Statistics

    Analyzing data

  • Software

    Working with data

  • Sources

    Getting data

  • Design

    Making data readable

Get the Book

Visualize This: The FlowingData Guide to Design, Visualization, and Statistics

Available now.

Order: Amazon / Bookshop

Made by FlowingData

  • The Process

  • Data Underload

  • Chart Everything

  • Guides

  • Books

  • Shop

  • About
  • Contact
  • Newsletter
  • LinkedIn
  • Instagram
  • Bluesky
  • RSS
Copyright © 2007-Present FlowingData. All rights reserved.