• Membership
  • Newsletter
  • Projects
  • Learning
  • About
  • Member Login
  • Data Underload  /  comments, Reddit

    Growth of Subreddits

    As of September 2018, there were 892 million comments for the year so far, spread out over 355,939 subreddits. Here’s how it got to this point, and “what the internet has been talking about” during the past 12 years.

    Read More
  • Interactive comic to remember things better

    October 29, 2018

    Topic

    Infographics  /  memory, Nicky Case

    In a time we commit less to memory and rely more on technology supplements, Nicky Case provides an interactive comic to teach the science of spaced repetition, which can be used to “remember anything forever-ish.” My memory is horrible, and it only gets worse with time. I needed this.

  • Visualizing science

    October 26, 2018

    Topic

    Infographics  /  science, Scientific American

    Jen Christiansen spoke about her extensive experience as a graphics editor for Scientific American. Her talk notes span a wide range of topics from the “rules”, the spectrum of visualization, and collaboration:

    [S]ome of my favorite recent Scientific American graphics are the result of bringing together different artists—plucking experts from each of those groups and matching them up to create a final image that draws upon all of their strengths, not forcing one artist to excel in all areas. For example, I love to take an artist who can develop spot illustrations with a stylus or pen, and pair them up with an artist who can custom code data visualization solutions, as in this example by Moritz Stefaner and Jillian Walters.

  • Tree of Life

    October 25, 2018

    Topic

    Network Visualization  /  evolution, life

    From Evogeneao:

    This Tree of Life diagram is based primarily on the evolutionary relationships so wonderfully related in Dr. Richard Dawkins’ The Ancestor’s Tale, and timetree.org. The smallest branches are purely illustrative. They are intended to suggest the effect of mass extinctions on diversity, and changes in diversity through time. This diagram is NOT intended to be a scholarly reference tool! It is intended to be an easy-to-understand illustration of the core evolution principle; we are related not only to every living thing, but also to everything that has ever lived on Earth.

    Design-wise, there are many things that could’ve made the graphic more readable, but something about it makes me like it just the way it is.

  • Members Only

    Enjoy the Curve, Tools and Additional Resources Roundup – October 2018

    October 25, 2018

    Topic

    The Process  /  learning, roundup

    Most people interested in visualization have made a chart with Microsoft Excel. For your basic charts, it’s really easy, and it works well for what it was intended for. The process of visualizing data with methods beyond the standard chart types can be more challenging at times.

  • Geography of voter turnout

    October 24, 2018

    Topic

    Maps  /  election, voting, Washington Post

    Based on data from Dave Leip’s Atlas of U.S. Presidential Elections, The Washington Post mapped voter turnout on a diverging color scale. Orange represents lower than average turnout in 2016 and purple represents higher than average.

    Not to diminish the meaning of the map, but the most shocking part might be the placement of Hawaii.

  • High school statistics class builds election prediction model

    October 23, 2018

    Topic

    Statistics  /  election, government, students

    High school seniors, in the Political Statistics class at Montgomery Blair High School in Silver Spring, Maryland, built a prediction model for the upcoming elections:

    Under the guidance of Mr. David Stein, this model (which we named the Overall Results of an Analytical Consideration of the Looming Elections a.k.a. ORACLE of Blair) was developed by a group of around 70 high school seniors, working diligently since the start of September. Apart from the youth and enthusiasm that went into making it, the advantage our model has over professionally developed models is transparency. Unlike professionals, we need not have any secrets in regards to how our predictions are generated. In fact, the sections that follow attempt to detail exactly how we come up with all of the numbers involved in our model.

    I’m so glad this exists and that young people are learning how to make things like this. My high school self is jealous, because the only statistics he got to learn was punched into a TI-83 calculator.

  • Building statues of hope in augmented reality

    October 22, 2018

    Topic

    Data Art  /  Accurat, augmented reality, Google, hope

    Accurat, in partnership with the Google News Initiative, built an augmented reality app to build statues of hope:

    We live in a world awash with information. Every time we walk the street holding our phones, every time we perform a research online or buy a product with our credit card data is created and often time communicated to us. How can we make people care about a specific dataset? How can we form our own opinions and points of view on what matters to us? With Building Hopes we wanted people to take a stance on what they are hopeful for, even in a historical moment that many define as hopeless and bleak, and have them look at Google search data through this framework of their own creation.

    There’s a web version, but be sure to check out the AR version if you can. You walk around your area picking stones, each representing something to be hopeful for, and the app points to you to statues nearby that others built.

  • Education disparities

    October 19, 2018

    Topic

    Statistics  /  education, ProPublica, race

    There are many racial disparities in education. ProPublica shows estimates for the gaps:

    Based on civil rights data released by the U.S. Department of Education, ProPublica has built an interactive database to examine racial disparities in educational opportunities and school discipline. Look up more than 96,000 individual public and charter schools and 17,000 districts to see how they compare with their counterparts.

    Using white students as the baseline, compare opportunity, discipline, segregation, and achievement for black and Hispanic students.

    Be sure to click through to a school district or state of interest to see more detailed breakdowns of the measures.

  • A closer look at the U.S.-Mexico border

    October 18, 2018

    Topic

    Maps  /  border, satellite imagery, Washington Post

    The Washington Post provides a flyover view of the barriers at the U.S.-Mexico border. It’s a combination of satellite imagery, path overlays, and information panels as you scroll. It gives an inkling of an idea of the challenges involved when people try to cross the border.

  • Members Only

    Data Graphics Workflow

    October 18, 2018

    Topic

    The Process  /  workflow

    As I worked on a wide range of charts recently, I got to thinking about workflow. How does one get from dataset to finished data graphic? This is my process.

  • Guides  /  population, questions

    Ask the Question, Visualize the Answer

    Let’s work through a practical example to see how asking and answering questions helps guide you towards more focused data graphics.

    Read More
  • Optimized bubble tea consumption

    October 16, 2018

    Topic

    Statistics  /  boba, simulation

    When you drink bubble tea, ideally you’d like to finish with the same proportions of boba and tea that you started at. Krist Wongsuphasawat took care of the math and provides a simulator for this ever important challenge:

    This article simulates an optimized sip based on amount of boba and tea in the straw before sipping (method adopted from this post). The simulation assumes that all bobas sit in the bottom of the cup and stack on top of each other nicely. If you put a straw straight down when there are n layers of bobas, you will get n bobas in the straw. The rest of the straw up to the drink’s height is tea. The drinker sips until all n bobas are in his/her mouth then stop. After each sip these n bobas and tea inside the straw are gradually reduced from the cup.

    The final recommendations: use a slim cup, minimize ice, and drink strongly. Mess around with variables here.

  • Mapping all the buildings

    October 15, 2018

    Topic

    Maps  /  buildings, New York Times

    A few months back, Microsoft released a comprehensive dataset that included the estimated footprints of all of the buildings in the United States. The New York Times mapped all of it.

    The footnote says a lot about their attention to detail:

    In some cases, the building shapes generated by Microsoft’s automated process do not match the existing building footprints exactly. We manually corrected as many of these mistakes as we found, or, where available, replaced the shapes using more precise local data sets. Data was unavailable for much of Alaska.

  • Mapping predominant race block by block

    October 12, 2018

    Topic

    Maps  /  National Geographic, race

    Based on data from the Census Bureau, National Geographic mapped predominant race in 11 million administrative regions in the United States. Many of the regions are the size of a single block.

    Looking at the national overview, the country looks predominantly white (represented blue), but as you zoom in for more details, you start to see the mix.

  • Create your own visual journal of data

    October 11, 2018

    Topic

    Data Art  /  book, Giorgia Lupi, self-surveillance, Stefanie Posavec

    Giorgia Lupi and Stefanie Posavec continue on their path of Dear Data with a book that you draw in: Observe, Collect, Draw!

    The first section describes some of the basics of journaling with data and how you can use various visual encodings. However, the main part of the book is a journal that guides you through collection and the visual encodings that Lupi and Posavec used with their postcards. First, there’s an instruction page and then the adjacent page provides blank scales for you to sketch yourself.

    Fun. It seems like a good way to jog your imagination, in case you feel like you’re stuck in a bar chart geometry funk. [Amazon link]

  • Members Only

    No Data, Chart Dies

    October 11, 2018

    Topic

    The Process  /  analysis, components

    If the charts themselves are fairly straightforward without any dubious design choices, are you still “lying with charts” when only the data itself was manipulated?

  • How to Make an Animated Pyramid Chart with D3.js

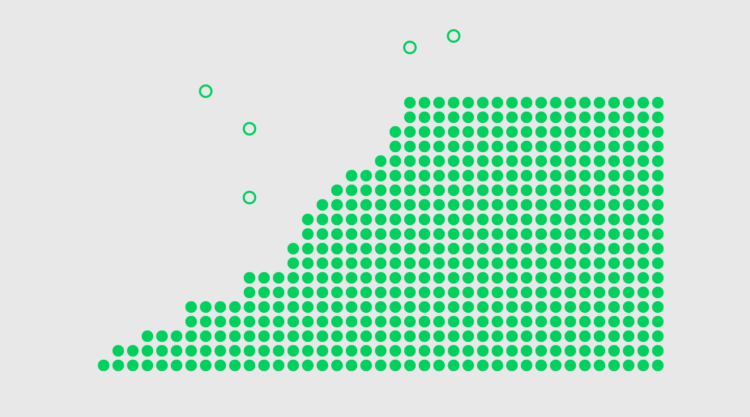
    Compare distributions side-by-side with a pyramid chart. Observe the change over the years by animating it.

  • News homepage design overview

    October 10, 2018

    Topic

    Infographics  /  homepage, news, Noah Veltman

    As you click through the news, you can probably almost always figure out what source is loading without the URL or title. Just judge based on the layout. Noah Veltman made this overview to show how news orgs prioritize editorial content, ads, and sponsored content.

  • Measuring the varied sentiments of good and bad words

    October 9, 2018

    Topic

    Statistical Visualization  /  sentiment, words

    There was a survey a while back that asked people to provide a 0 to 100 percent value to probabilistic words like “usually” and “likely”. YouGov did something similar for words describing good and bad sentiments.

  • Page 135 of 392
  • <
  • 1
  • ...
  • 132
  • 133
  • 134
  • 135
  • 136
  • 137
  • ...
  • 392
  • >

Analyze, visualize, and communicate data usefully, beyond the defaults.

Become a member →

Recently for Members

May 8, 2025
When the data is not what it seems

May 1, 2025
Finding the Right Charts

April 24, 2025
Visualization Tools, Datasets, and Resources – April 2025 Roundup

April 17, 2025
Breaking Out of Chart Software Defaults

April 15, 2025
Line Chart with Decorative Neon Accents

Browse by Chart Type See All →

Heatmap Bubble Chart Surface Plot Variable Width Bar Chart Frequency Trails Sankey Diagram Beeswarm Choropleth Map Stacked Bar Chart Bar Chart

Browse By Topic

  • Visualization

    Seeing data

  • Maps

    Seeing geographic data

  • Infographics

    Explaining data

  • Networks

    Connecting data

  • Statistics

    Analyzing data

  • Software

    Working with data

  • Sources

    Getting data

  • Design

    Making data readable

Get the Book

Visualize This: The FlowingData Guide to Design, Visualization, and Statistics

Available now.

Order: Amazon / Bookshop

Made by FlowingData

  • The Process

  • Data Underload

  • Chart Everything

  • Guides

  • Books

  • Shop

  • About
  • Contact
  • Newsletter
  • LinkedIn
  • Instagram
  • Bluesky
  • RSS
Copyright © 2007-Present FlowingData. All rights reserved.