While we’re on the subject of distributions, Fathom used a collection of beeswarm charts to show documents about the Mueller investigation over time and connections between individuals. It’s called Porfiry. Filled circles represent documents that represent connections, and circle size represents the number of documents.
Connections and patterns in the Mueller investigation
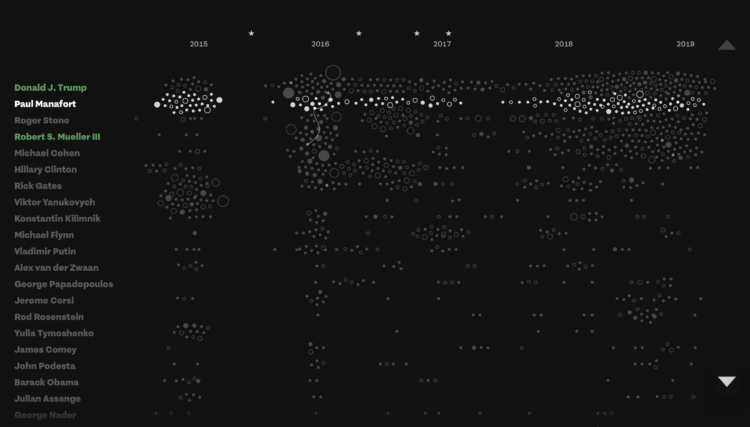
Chart Type Used

Second Edition
 Visualize This: The FlowingData Guide to Design, Visualization, and Statistics (2nd Edition)
 Visualize This: The FlowingData Guide to Design, Visualization, and Statistics (2nd Edition)
New tools, refined process.