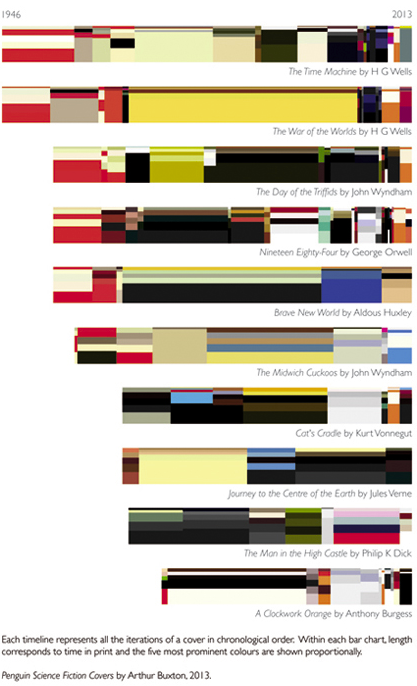
Arthur Buxton plotted the most common colors of Penguin Publishing science fiction colors and arranged them over time. Also available in print.
I wonder if there’s a good way to show connections between the titles or the different covers for each title.
 Visualize This: The FlowingData Guide to Design, Visualization, and Statistics (2nd Edition)
Sure, there is; there is the histogram, which is a 2D vector (if you discount the lightness).