Luis Melgar and Rachel Lerman, for the Washington Post, highlight the value of…
Statistical Visualization
Finding patterns, distributions, and anomalies.
-
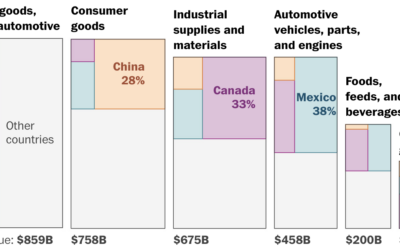
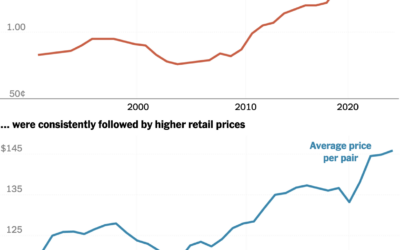
Products affected by tariffs in the U.S.
-
Imports that could be taxed
We’ve mostly heard about tariffs as they apply further down the supply chain…
-
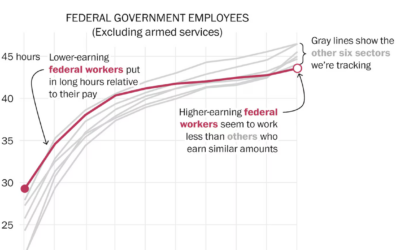
Estimating the ‘laziness’ of federal workers
Some might have you believe that federal employees don’t put in the work.…
-
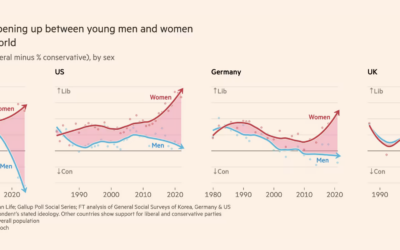
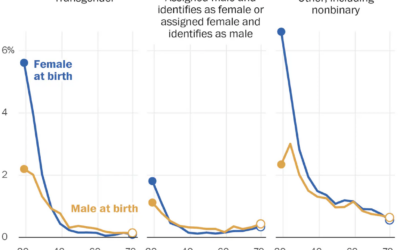
Growing gender gap in ideology
For Financial Times, John Burn-Murdoch shows the gap between men and women in…
-
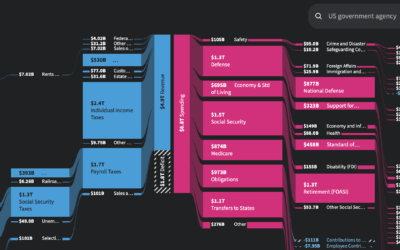
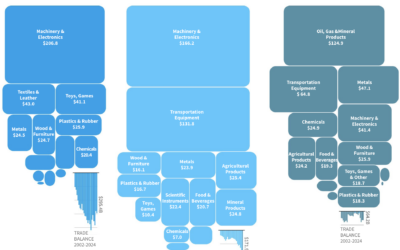
Government revenue and spending diagram
In case you’re wondering about government spending and budgets, USAFacts has a Sankey…
-
How tariffs work
I think I’ve read about tariffs more in the past month than I…
-
Charting data that might disappear soon
The administration continues its takedown of data that it doesn’t agree with. To…
-
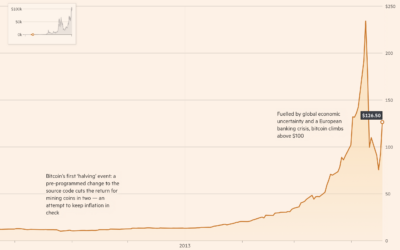
Rise and fall and rise again for bitcoin
There was a moment a few years ago when cryptocurrency was mentioned everywhere…
-
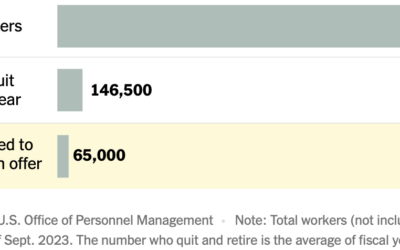
Federal worker resignations
According to the U.S. Office of Personnel Management, about 65,000 federal workers have…
-

Common four-digit PINs of others
About 1 in 10 people use the same four-digit PIN, based on an…
-
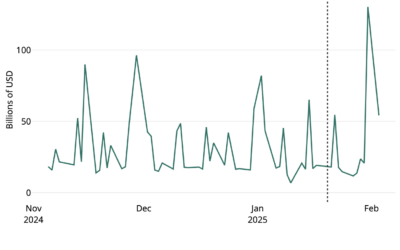
Tracking daily federal expenditures
The Hamilton Project is tracking federal expenditures and updating daily:
This data interactive… -
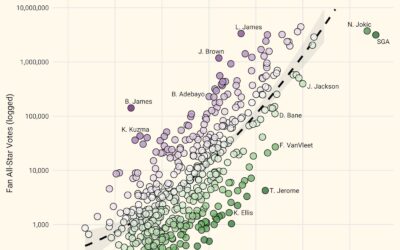
Overrated NBA all-star votes
NBA all-star voting is mostly for the fans, which means some players can…
-
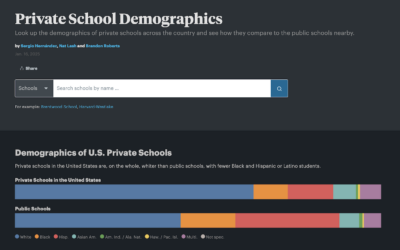
Private school demographics
Private schools cost extra. So as you might imagine, the demographics, often tied…
-
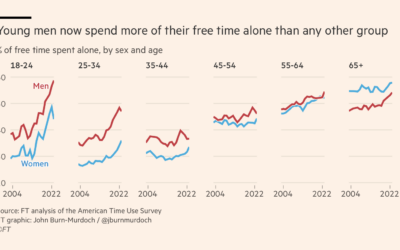
Young and alone
John Burn-Murdoch, for Financial Times (paywalled), breaks down data from the American Time…
-
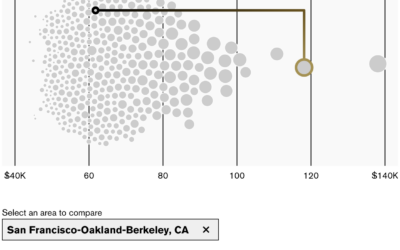
Where you would feel richer and poorer
New to me, Bloomberg has an interactive by Claire Ballentine and Charlie Wells…
-
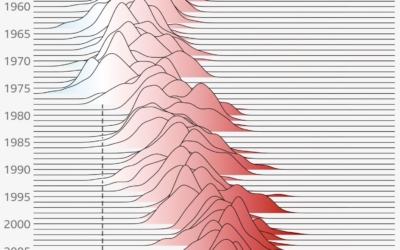
Distribution of days that were hotter than average
BBC went with the gradient-filled frequency trails to show the distribution of daily…
-
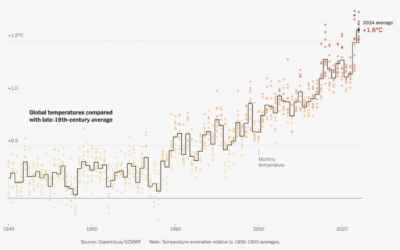
Earth was hotter than ever, again
This is some good step charting by Mira Rojanasakul for the New York…
-
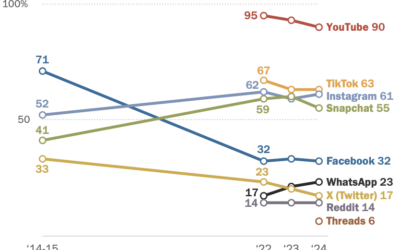
Social media app preferences of young teenagers
Pew Research published their annual report on what social media U.S. 13- to…
Recently for Members
Second Edition
 Visualize This: The FlowingData Guide to Design, Visualization, and Statistics (2nd Edition)
 Visualize This: The FlowingData Guide to Design, Visualization, and Statistics (2nd Edition)
New tools, refined process.
Browse by Chart Type See All →


