G. Elliot Morris, for Strength in Numbers, breaks down the shift towards Democrat…
Statistical Visualization
Finding patterns, distributions, and anomalies.
-

Shifts left for every demographic group, 2025 elections
-

China exports down in October
From Bloomberg:
China’s exports unexpectedly contracted in October as global demand failed to… -

Tariffs on U.S. imports, variable by country
At the beginning of this year, most people probably had little awareness or…
-

Chinese exports grow, without the U.S.
The U.S. is buying a lot less from China this year, but China…
-

Looking for an AI bubble in the markets
Peter Oppenheimer, the chief global equity strategist for Goldman Sachs, points to the…
-

Fashion color counting
As fashion changes, so do the colors used each season. Sarah Constantin likes…
-

Too soon to declare inflation victory
Declarations have been made, but there’s not enough data yet to make such…
-

Historical (lack of) change in home prices in major cities
For the Washington Post’s Department of Data, Andrew Van Dam looks at historical…
-

50 Cent adjusted for inflation
The rapper Curtis Jackson became 50 Cent a couple of decades ago, but…
-

Fraudulent disability claims through Veterans Affairs
For the Washington Post, Craig Whitlock, Lisa Rein, and Caitlin Gilbert examine court…
-

Using mega batteries to power the evening
When there is an excess of solar energy during the day, it can…
-

Cost of driving an electric vehicle vs. gas car
The cost of driving an electric vehicle varies by where you charge and…
-
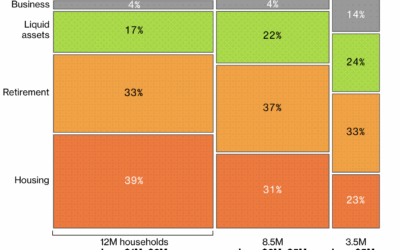
Cash-poor millionaire households
Everyone loves reading about millionaires who don’t have enough liquidity to buy things,…
-
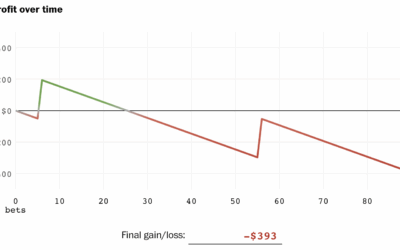
Odds against you in sports parlays, advantage house
Parlays in sports betting are booming and people are losing billions of dollars…
-
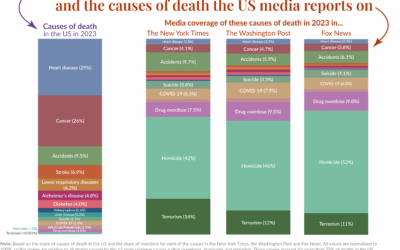
Mortality in the news vs. what we usually die from
Our World in Data compared causes of death in the United States against…
-
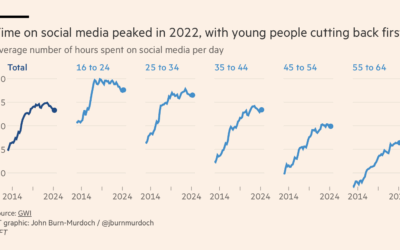
Passed peak social media, maybe
As we descend towards slop-based social media, where the videos are fake and…
-
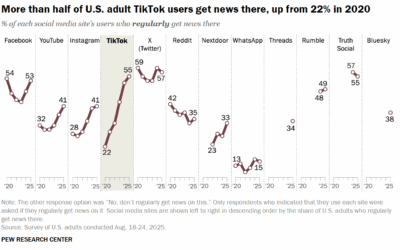
Getting more news from the TikTok
Pew Research surveyed U.S. adults about news consumption on social media and found…
-
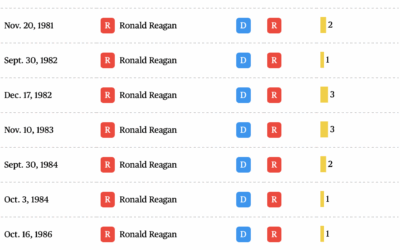
Length of government funding gaps
The government shutdown of 2025 begins. Here is a quick table by Nigel…
Recently for Members
Second Edition
 Visualize This: The FlowingData Guide to Design, Visualization, and Statistics (2nd Edition)
 Visualize This: The FlowingData Guide to Design, Visualization, and Statistics (2nd Edition)
New tools, refined process.
Browse by Chart Type See All →


