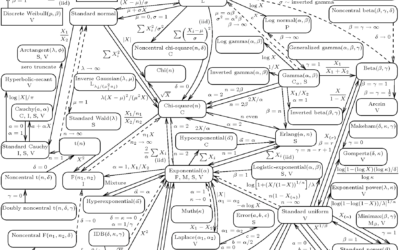
The network of 76 probability distributions show how they are connected:
Solid lines…
Network Visualization
Fun with links, nodes, and edges.
-
Network of statistical distributions
-
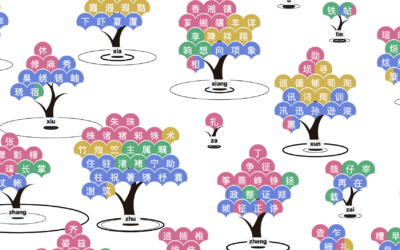
Chinese names lost in translation
Liuhuaying Yang aims to clarify the names and sounds that get lost when…
-
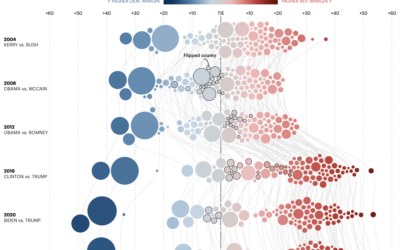
Margin of victory over past elections, in Minnesota
For the Minnesota Star Tribune, Yuqing Liu and C.J. Sinner show how the…
-
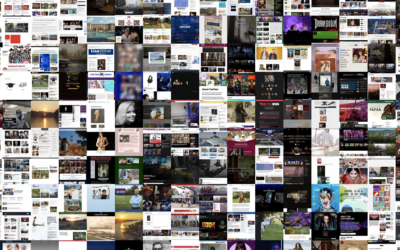
One million screenshots of the web’s homepages in a single layout
One Million Screenshots, by Urlbox, is a collection of 1,048,576 homepage screenshots in…
-
Visually navigate code as stars and galaxies
Andrei Kashcha visualized major software packages as galaxies that you can fly through.…
-
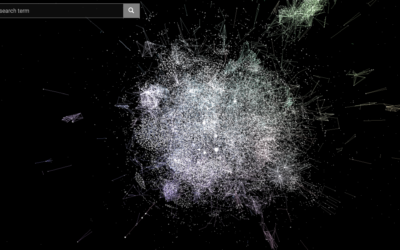
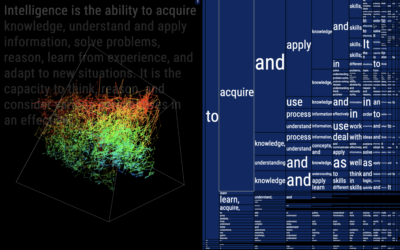
Visualizing the statistical connections behind ChatGPT
To gain a better understanding of how ChatGPT works under the hood, Santiago…
-
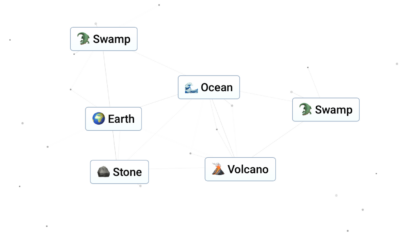
Infinite Craft with large language model
Start with water, fire, wind, and earth and see what you can craft…
-
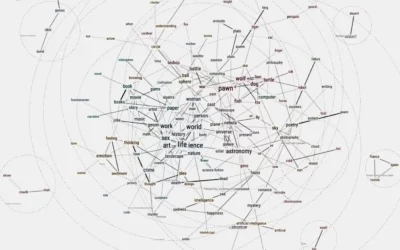
Friend simulation system, with ChatGPT
Philippe Vandenbroeck and Santiago Ortiz were curious about a system that incorporated knowledge…
-
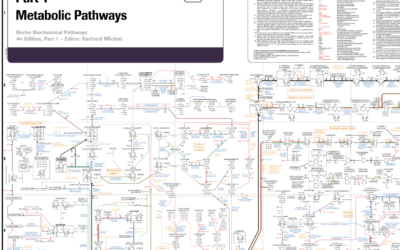
Big diagram of metabolic pathways
The contents of this diagram is not in my scope, but it is…
-
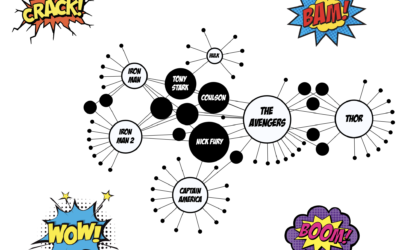
Network for Marvel Cinematic Universe
With a fun view of the Marvel Cinematic Universe, Tristan Guillevin walks through…
-
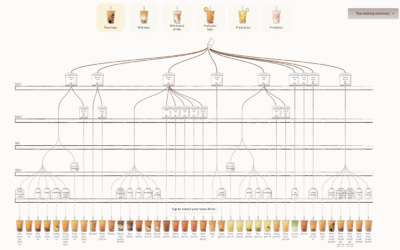
Bubble tea combinations, a visual breakdown
Walk into a boba shop and usually you’ll see a large menu that…
-
Visualizing 16th century letter correspondence of the Tudor government
Kim Albrecht, Ruth Ahnert, and Sebastian Ahnert visualized the network of communications over…
-
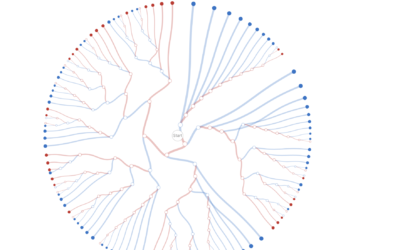
Decision tree for the presidential election result
While we’re on the topic of election scenarios, Kerry Rodden provides a radial…
-
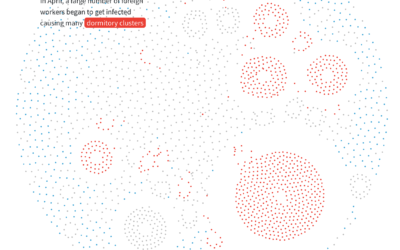
Anatomy of an outbreak
For Reuters, Manas Sharma and Simon Scarr animated a coronavirus outbreak in Singapore…
-
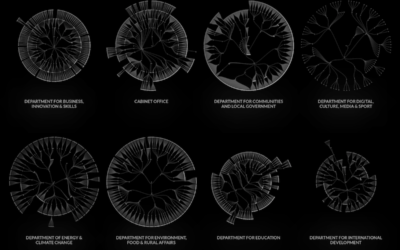
UK government org charts
When I think government structure, I tend to think in general overviews where…
-
Interactive explainer for how disease and ideas spread through a network
Kevin Simler uses interactive simulations to explain how things — ideas, disease, memes…
-
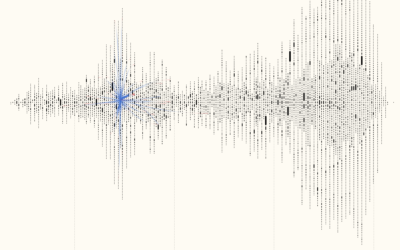
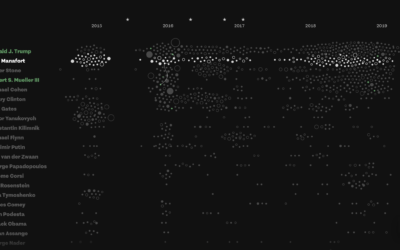
Connections and patterns in the Mueller investigation
While we’re on the subject of distributions, Fathom used a collection of beeswarm…
-
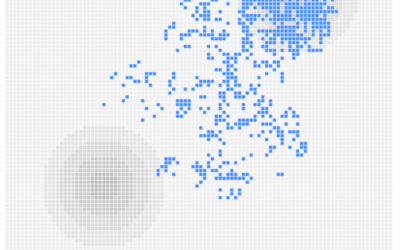
Distorting geography to show train travels
Jan Willem Tulp visualized train travel times using distance and color as an…

 Visualize This: The FlowingData Guide to Design, Visualization, and Statistics (2nd Edition)


