Grid/plane, a studio centered in Portland Orgeon, collaborated with Instrument, to visualize media…
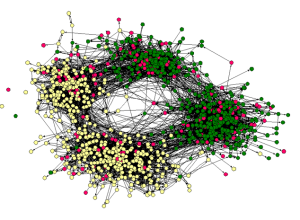
Network Visualization
Fun with links, nodes, and edges.
-
Data Visualization Sketches for Google Search Results
-
Researchers Map Chaos Inside Cancer Cell
The thing about cancer cells is that they suck. Their DNA is all…
-
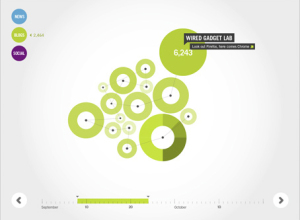
Visualizing YouTube, Blogs, Twitter, Flickr, People…
From the guys who brought you 6pli and other like-minded network visualization tools,…
-
maeve Installation Shows Relationships Between Projects
The Interface Design Team at the University of Potsdam revealed maeve last week.…
-
Interactive Graph Visualization System – Skyrails
Skyrails is an interactive graph visualization system that looks a lot like a…
-
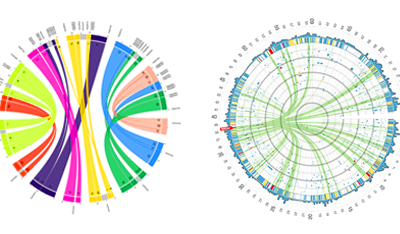
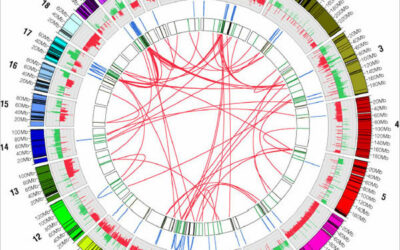
Visualize Genomes and Genomic Data – Circos
Circos is a project by Martin Krzywinski that lets you upload genomic data…
-
Facebook Lexicon – Trends for Writings on the Wall
Facebook recently released Lexicon which is like a Google Trends or Technorati for…
-
What Interests Do Your Facebook Friends Have in Common?
Nexus, by Ivan Kozik, lets you explore your Facebook social network and find…
-
17 Ways to Visualize the Twitter Universe
I just created a new Twitter account, and it got me to thinking…
-

Names Mentioned in Debates by Major Presidential Candidates
As usual, The New York Times graphics department churns out another useful graphic. This time it’s in network diagram form.
-
Difficulty Visualizing Social Networks
We need to interact with others. We crave connections with friends and strangers.…
Recently for Members
Second Edition
 Visualize This: The FlowingData Guide to Design, Visualization, and Statistics (2nd Edition)
 Visualize This: The FlowingData Guide to Design, Visualization, and Statistics (2nd Edition)
New tools, refined process.
Browse by Chart Type See All →


