As you’ve probably heard, Apple and Samsung have been in a bit of…
Network Visualization
Fun with links, nodes, and edges.
-
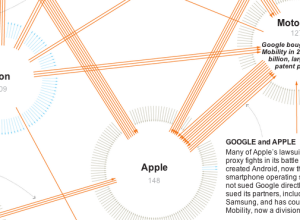
Patent war →
-

Every Lost episode visualized and recreated
Santiago Ortiz visualized every episode of the show in the interactive Lostalgic. It’s…
-
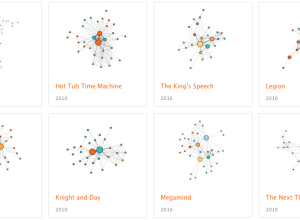
Character social networks in movies
We’ve seen a lot of network charts for Twitter, Facebook, and real people.…
-
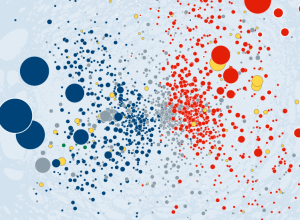
Network of political contributions →
The Wall Street Journal visualized major political contributions, according to the Federal Election…
-
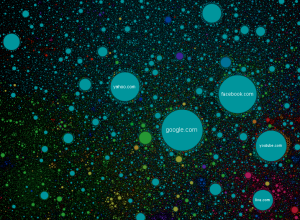
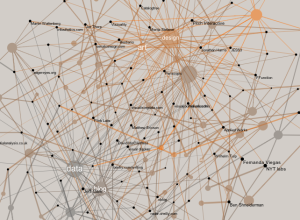
Map of the Internet
Ruslan Enikeev created a searchable Internet map of links and bubbles, showing over…
-
Browse the web of Wikipedia with Wikiweb iPad app
While we’re on the subject of the web that is Wikipedia, four-man, Baltimore-based…
-
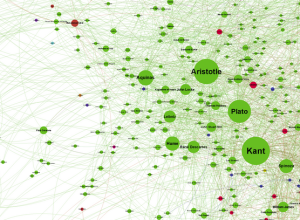
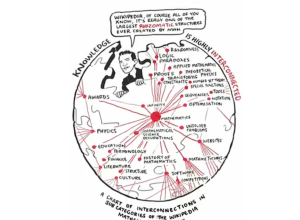
Graphing every idea in history →
Brendan Griffen created a giant network of people, using every profile on Wikipedia…
-
Network of data visualization references
Developer Santiago Ortiz explores visualization references through Delicious tags and puts them in…
-
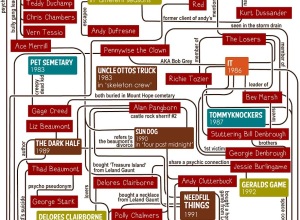
Flowchart: Connections in Stephen King novels
There are various connections between Stephen King novels. Gillian James puts them in…
-
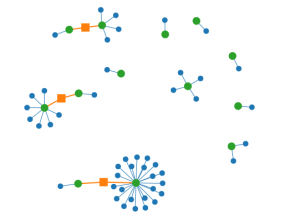
Network diagrams simplified
Network diagrams are notoriously messy. Even a small number of nodes can be…
-
Manuel Lima’s animated talk
Wow, Manuel Lima, Senior UX Designer at Bing, got through a world of…
-

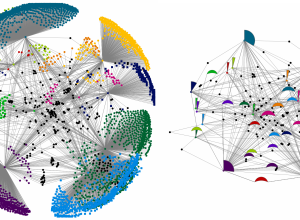
Agreement groups in the US Senate
PhD student Adrien Friggeri demonstrates a new clustering algorithm with a visualization of…
-

Where Campaign Spending is Going to
Making use of data from the Federal Election Commission and The New York…
-
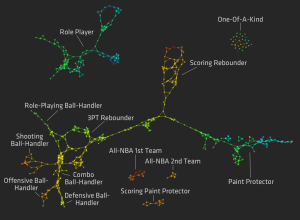
Redefining NBA Basketball Positions
For the MIT Sloan Sports Analytics Conference a few weeks ago, Stanford biomechanical…
-
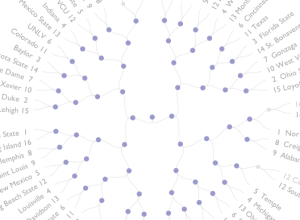
March Madness power rankings
With NCAA March Madness in full swing, the basketball graphics are out in…
-
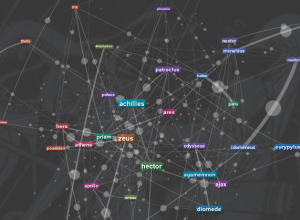
Character relationships in the Iliad
The Iliad is an epic poem by Homer with a lot of characters…
-
Password reuse visualizer from Mozilla
When you use the same password for every online account, there could be…
-
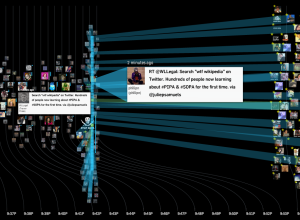
Watching ‘wtf Wikipedia’ as SOPA/PIPA blackout begins
While SOPA and PIPA are no laughing matter (join the strike), the reaction…
Recently for Members
Second Edition
 Visualize This: The FlowingData Guide to Design, Visualization, and Statistics (2nd Edition)
 Visualize This: The FlowingData Guide to Design, Visualization, and Statistics (2nd Edition)
New tools, refined process.
Browse by Chart Type See All →


