I’m pretty sure I’m not in their target audience, but my main takeaway…
Apps
Software that makes a part of your data job easier.
-
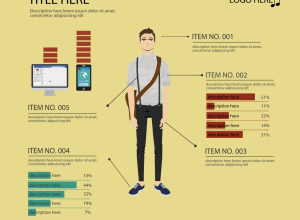
Automated infographics with easel.ly
-

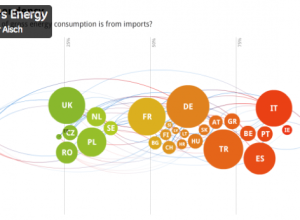
WolframAlpha Pro launches in an effort to democratize data science
Taking the next step in the Wolfram|Alpha experiment, Wolfram launches a Pro version…
-
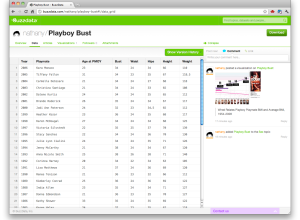
BuzzData aims to make data more social
In many ways, data wants to be social. It wants to get out…
-
On the Launch of Visually
A couple of weeks ago, Visually, a new infographics-based startup, launched with a…
-
Visualizing Player makes it easier to share visualization
It’s easy to share static graphics. Save an image and then upload it…
-

Make Sankey flow diagrams with Fineo, sort of
Whenever I post a Sankey diagram (for example, here, here, and here), someone…
-
Dotspotting to make city data more legible
Last year Stamen Design received a grant from the Knight News Challenge to…
-
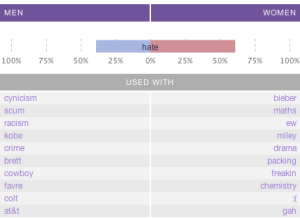
Gender and time comparisons on Twitter
Men and women are different. You know that. But do they tweet differently?…
-
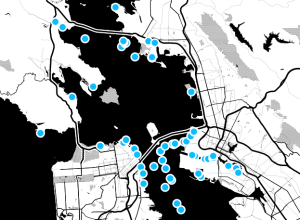
GeoCommons 2.0, now with more mapping features
GeoCommons, an open repository of data and maps, launched version 2.0 this week,…
-
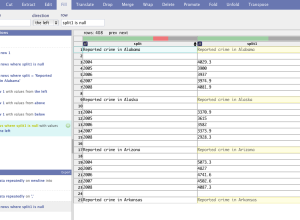
DataWrangler for your data formatting needs
Formatting data is a necessary pain, so anything that makes formatting easier is…
-
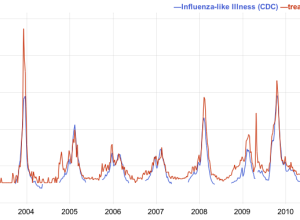
Google Correlate lets you see how your data relates to search queries
A while back, Google showed how Influenza outbreaks correlated to searches for flu-related…
-
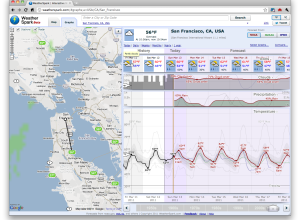
WeatherSpark for more graphs about the weather than you will ever need
You know Matthew Ericson’s simple weather mashup? It shows only what you need…
-
Google opens up Public Data Explorer to your data
With Google’s recent data-related offerings, it shouldn’t come as much of a surprise…
-

Find more of the data you need with DataMarket
Add another online destination to find the data that you need. DataMarket launched…
-
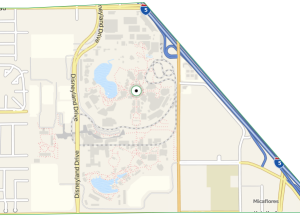
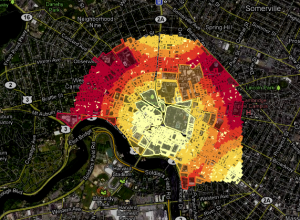
This Tract provides a view of Census data on your block
This Tract, by Michal Migurski of Stamen, with some help from Craig Mod,…
-
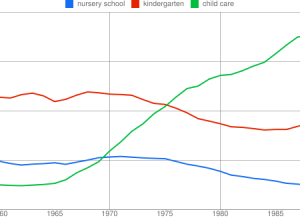
Search how phrases have been used via Google Ngram Viewer
Language changes. Culture changes. And we can see some of these changes via…
-

Advanced visualization without programming – Impure
Programming can be tough in the beginning, which can make advanced visualization beyond…
-
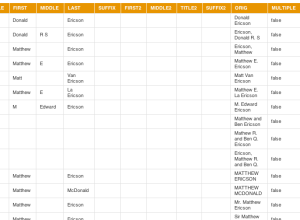
Find the names in your data with Mr. People
Inspired by Shan Carter’s simple data converter, appropriately named Mr. Data Converter, Matthew…
-
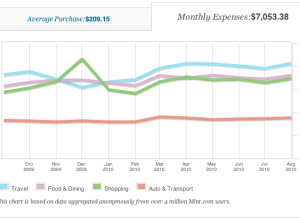
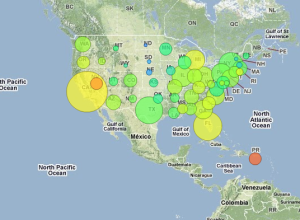
How people in your area spend money
The personal finance site Mint aggregates spending data from four million users. At…
-
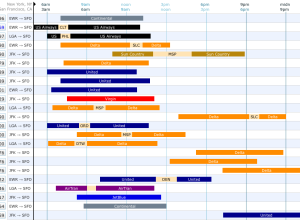
Find your flight via visual interface
Booking flights became so much easier when it all shifted online, but it…
Recently for Members
Second Edition
 Visualize This: The FlowingData Guide to Design, Visualization, and Statistics (2nd Edition)
 Visualize This: The FlowingData Guide to Design, Visualization, and Statistics (2nd Edition)
New tools, refined process.
Browse by Chart Type See All →


