Last year Stamen Design received a grant from the Knight News Challenge to design and implement Citytracking, a project to help people gather data about their cities and gain some kind of understanding about it. Dotspotting, the phase of the project, just launched. It makes it much easier to put dots on a map.
There’s currently a whole chain of elements involved in building digital civic infrastructure for the public, and these are represented by various Stamen projects and those of others. At the moment, the current hodgepodge of bits — including APIs and official sources, scraped websites, sometimes-reusable data formats and datasets, visualizations, embeddable widgets etc. — is fractured, overly technical and obscure, held in the knowledge base of a relatively small number of people, and requires considerable expertise to harness. That is, unless you’re willing to use generic tools like Google Maps. We want to change this. Visualizing city data shouldn’t be this hard, or this generic.
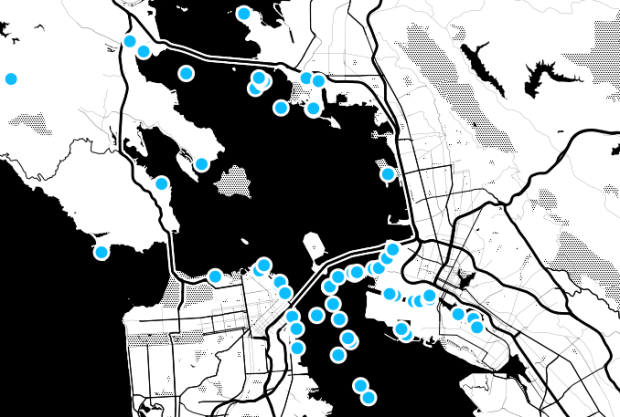
The process is pretty simple. Once you’ve created an account, upload a list of addresses (or latitude and longitude if you like) as CSV, RSS, or an Excel spreadsheet, and Dotspotting will handle the rest (i.e. geocoding and placement). Bam. Map with dots.
Here’s the important part of Dotspotting though. It’s not just about getting an online map that you can interact with. It’s about making location data easier to distribute. After you’ve made your map and filtered to your liking you can export the geocoded data in most major geo formats or download the map itself. Print, edit, and/or share without having to worry about the technical bits.
 Visualize This: The FlowingData Guide to Design, Visualization, and Statistics (2nd Edition)