Gas-powered vehicles contribute a big part of total carbon production, so to get…
Infographics
Telling stories with data and graphics.
-
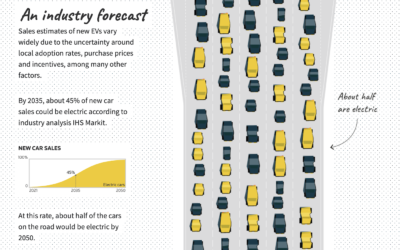
Improving electric vehicle adoption rates
-
A game to gerrymander your party to power
Ella Koeze, Denise Lu, and Charlie Smart for The New York Times made…
-
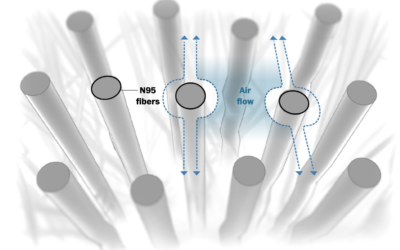
How N95 masks work
In efforts to reduce further spread of the virus, the US is set…
-

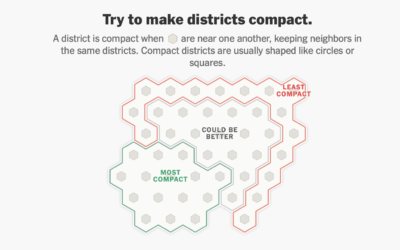
Play miniature golf, learn about congressional redistricting
Congressional redistricting and gerrymandering are important topics, because they can directly change election…
-

Scale of the bigger, more detailed universe
We’ve learned more about the universe since Charles and Ray Eames produced Powers…
-

Powers of Ten
The Powers of Ten by Charles and Ray Eames from 1977 shows the…
-
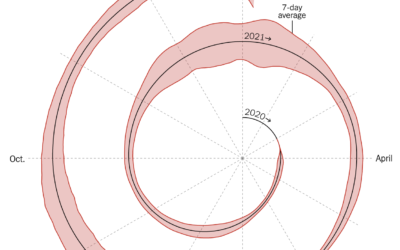
Spiral graph to show Covid-19 cases
This spiralized chart by Gus Wezerek and Sara Chodosh for NYT Opinion has…
-
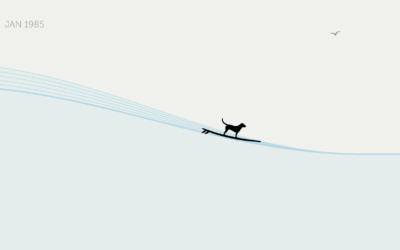
Four decades of oceanic wave moments, as a surfing game
Surf is a data-based game by Andy Bergmann that lets you move across…
-

Scale of black holes
I’m not sure there’s any way to really understand the scale of the…
-

Virtual proctoring simulation
Many colleges use virtual proctoring software in an effort to reduce cheating on…
-
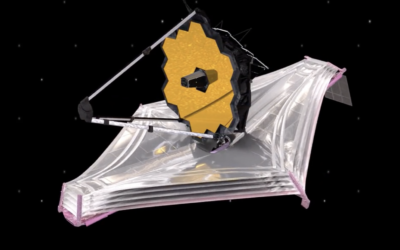
Launching a telescope to explore the Big Bang
NASA is launching the James Webb Space Telescope on December 22, 2021 with…
-
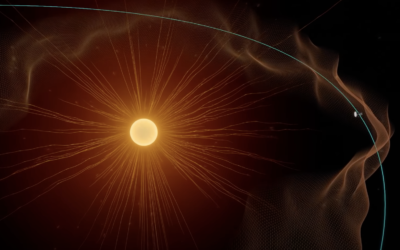
NASA solar probe touched the sun
NASA launched the Parker Solar Probe in 2018 in an effort to explore closer to the sun.
-
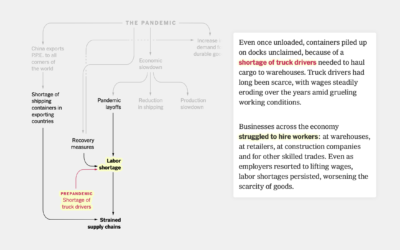
Flowchart for pandemic supply chain issues
Lazaro Gamio and Peter S. Goodman for The New York Times used a…
-

Climate change postcards from every country
The effects of climate change can be seen around the world, in the…
-
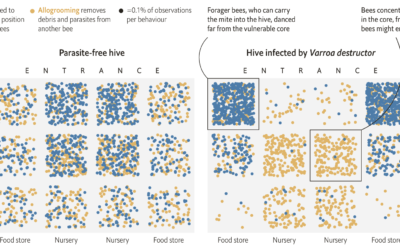
Bees use social distancing
Research by M. Pusceddu et al. shows that honeybees use social distancing when…
-
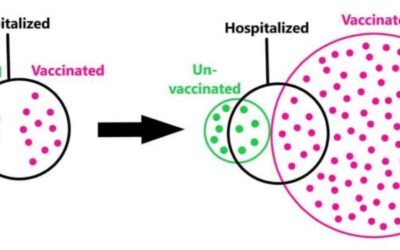
Euler diagram to illustrate base rate fallacy
Some people point out that vaccinated people are still hospitalized as a defense…
-
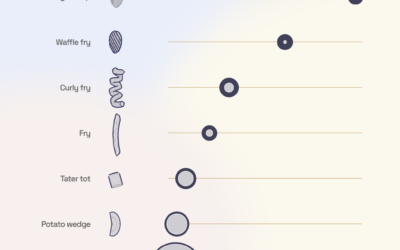
3-D modeling the french fry universe
What is the best french fry shape? Curly of course. But Chris Williams…
-
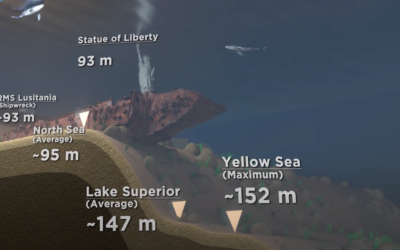
Scale of ocean depths
We know the oceans are deep, but it’s difficult to grasp the scale…
Recently for Members
Second Edition
 Visualize This: The FlowingData Guide to Design, Visualization, and Statistics (2nd Edition)
 Visualize This: The FlowingData Guide to Design, Visualization, and Statistics (2nd Edition)
New tools, refined process.
Browse by Chart Type See All →


