Modernized version of a mid-19th century encylopedia

Feb 10, 2022

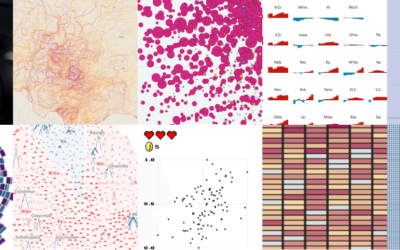
Between 1849 and 1851, J.G. Heck published a 10-part encyclopedia called Iconographic Encyclopædia covering a wide range of topics in science and art. Nicholas Rougeux, who likes to web-ify old works, restored Heck’s 13,000-plus illustrations and restructured the encyclopedia for the browser. All it took was hours of manual labor spread out over 13 months.

Read more about the process here.

Become a member. Support an independent site. Make great charts.

See What You Get

Favorites

Redefining Old Age

What is old? When it comes to subjects like health care and retirement, we often think of old in fixed terms. But as people live longer, it’s worth changing the definition.

Defense Against Dishonest Charts

This is a guide to protect ourselves and to preserve what is good about turning data into visual things.

Visualizing the Uncertainty in Data

Data is an abstraction, and it’s impossible to encapsulate everything it represents in real life. So there is uncertainty. Here are ways to visualize the uncertainty.

Peak Non-Creepy Dating Pool

Based on the “half-your-age-plus-seven” rule, the range of people you can date expands with age. Combine that with population counts and demographics, and you can find when your non-creepy dating pool peaks.