The New York Times collected drone footage and built a 3-D model to…
Nathan Yau
-

Gunman and countersnipers’ points of view during shooting
-
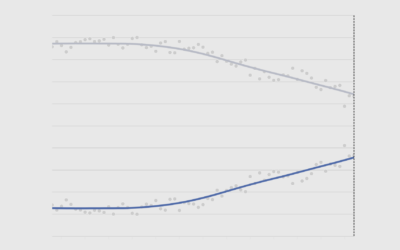
When Working Gets Harder With Age
Difficulties increase steadily over the years, but if we’re lucky enough to reach our 80s, there appears to be a steeper drop.
-
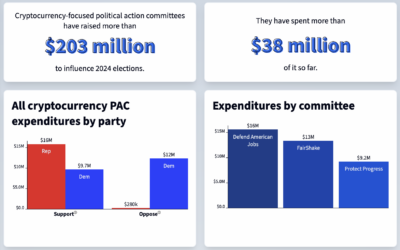
Cryptocurrency-funded politics
Those who run cryptocurrency companies have much to gain from policies that favor…
-

Nate Silver critiques the new 538 forecast model
Nate Silver, who left Disney and the FiveThirtyEight brand last year but took…
-

Overlap between area codes HTTP response headers
Like many, you’ve probably wondered what HTTP response headers are also area codes…
-
Members Only
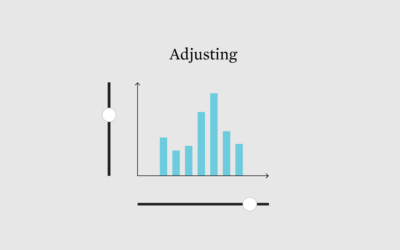
Sliding for Data
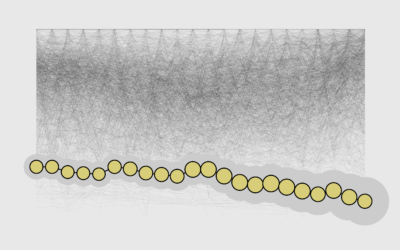
The slider, a common UI element with a range and a handle that you can drag, has been around for a long time. It’s proven to be useful for visualization.
-
Where immigrants in the U.S. came from
A lot of immigration talk in the U.S. focuses on Mexico, but immigrants…
-

Federal data at risk
It continues to grow more difficult for federal statistical agencies to accurately measure…
-

Shifts in post-apocalyptic worlds in science fiction films
Using science fiction films as a proxy for what we see in our…
-
Members Only

How to Use a Slider to Let Readers Customize Charts
A simple user-controlled slider can help readers look at a dataset from their own point of view.
-
Changing Difficulty of Getting Into Your College, Past Two Decades
It’s gotten more difficult to get into top colleges over the years, but most schools have either admitted students at the same rate or increased admission rates since 2001.
-
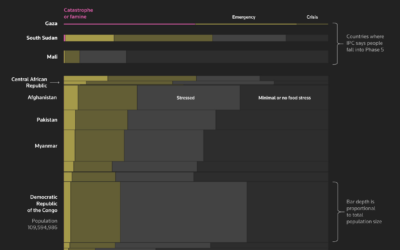
Famine prevalence in different countries
Reuters explores famine around the world through the lens of starving children in…
-
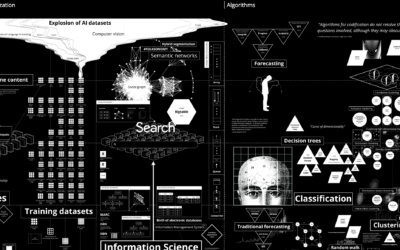
Genealogy of technology and power from the 1500s to present
Kate Crawford and Vladan Joler created a comprehensive view in Calculating Empires.
Calculating… -
Members Only

Splitting the Map
To make space for your map on a small screen, maybe just cut the map in half.
-
Designing EV sounds
Vox explains the process of designing artificial car sounds for electric vehicles to…
-
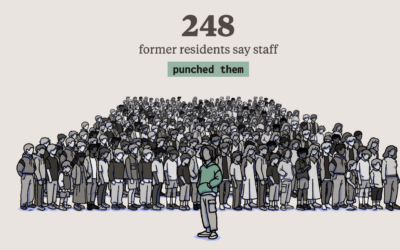
1,300 allegations against New Hampshire Youth Development Center
In a collaboration between NHPR and the Pudding, Jason Moon and Russell Samora…
-

College Admission Rates for U.S. Schools Compared
See how your college’s selectivity ranks against the rest.
-
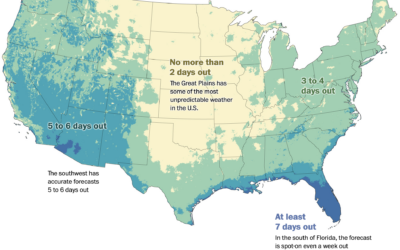
Accuracy of temperature forecasts where you live
You’ve probably noticed that the weather forecast can change a lot for predictions…
-
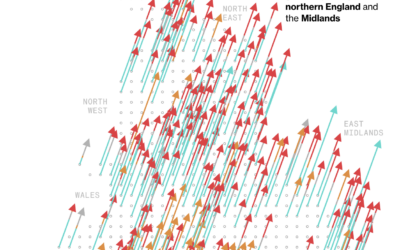
UK party gains and winners
Speaking of Conservatives losing, Andre Tartar and Demetrios Pogkas for Bloomberg show the…
-
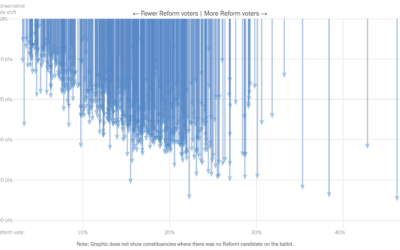
Conservatives lose UK election by a lot
For the New York Times, Josh Holder and Lauren Leatherby show how the…
Recently for Members
Second Edition
 Visualize This: The FlowingData Guide to Design, Visualization, and Statistics (2nd Edition)
 Visualize This: The FlowingData Guide to Design, Visualization, and Statistics (2nd Edition)
New tools, refined process.
Browse by Chart Type See All →


